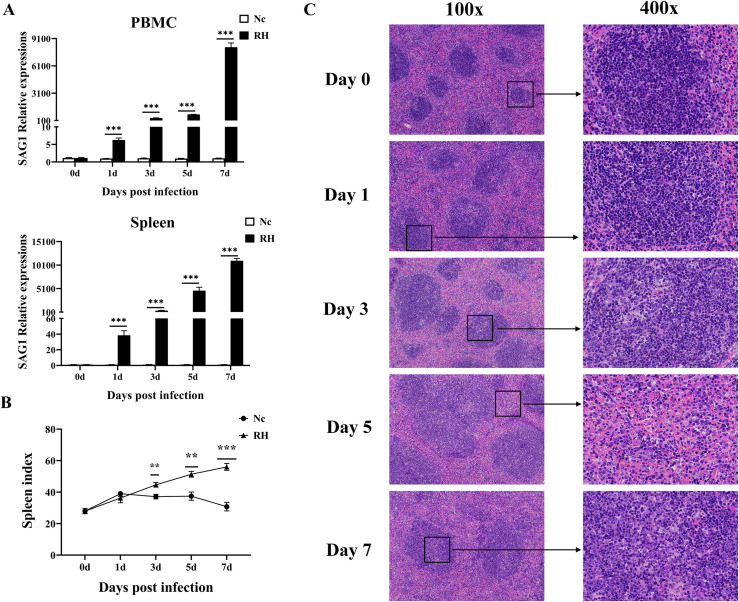
Fig. 4.
Dynamic pathological changes in the spleen during acute T. gondii infection. (A) Relative expression of TgSAG1 at 0, 1, 3, 5, and 7 days post infection in the PBMCs and spleen. (B) Spleen index values of the RH and Nc groups. The results are representative of three independent experiments with five mice per group per experiment; with data denoting means ± SDs; (C) H&E staining of spleen sections at different time points in the RH infection group. The original magnification was 100×, and the corresponding images on the right were magnified at 400×.

