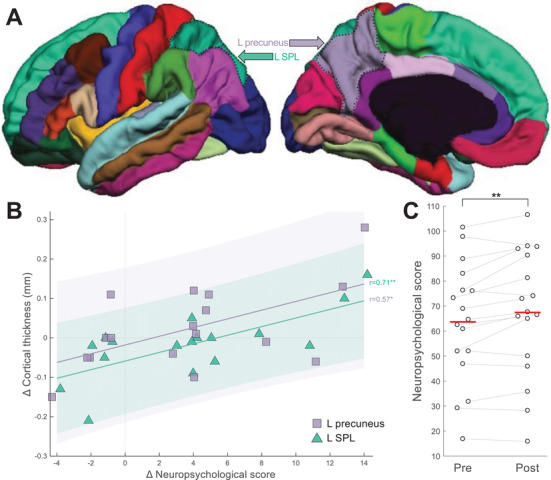
FIGURE 1.

Brain–behavior correlations. A, Regions of interest—namely left superior parietal lobule (SPL) and left precuneus—where a significant correlation (plotted in panel [B]) was observed between pre‐to‐post change in cortical thickness and in neuropsychological scores (corrected total score [CTS]). The two regions of interest are highlighted with dotted black contours on lateral and medial views of the DKT atlas parcellation; base image from the Mindboggle project (www.dataverse.harvard.edu/dataverse/mindboggle101). B, Data points in the scatter plot represent patients (N = 17; SPL: green triangles; precuneus: purple squares). Data points sharing the same x value are horizontally jittered by up to 0.25 units to aid visualization. Vertical/horizontal dotted gray lines correspond to no pre‐to‐post change in terms of neuropsychological score/cortical thickness. “Δ” in the axis labels refers to pre‐to‐post‐TPS change. C, Distribution of neuropsychological (CTS) scores, pre‐ and post‐TPS. Dots represent individual patients, with gray lines connecting values at pre and at post. Horizontal red lines indicate group means. * P < .05; ** P < .01
