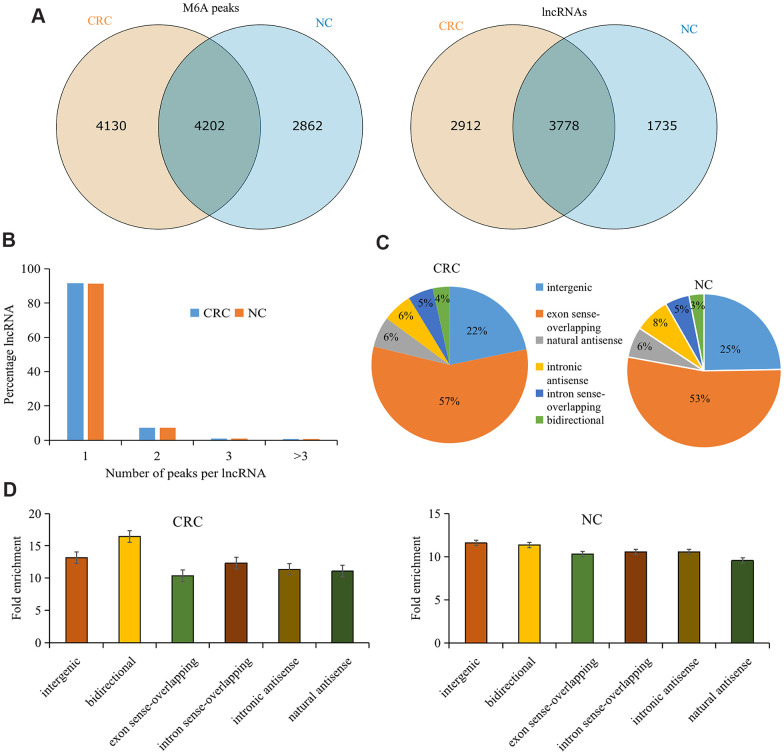
Figure 1.
Overview of M6A methylation within lncRNAs in CRC and tumor-adjacent normal tissues. (A) Venn diagram showing the numbers of cancer-unique, normal-unique, and common M6A peaks within lncRNAs in the two groups. (B) Proportions of lncRNAs harboring different numbers of M6A peaks in the two groups. (C) Pie charts showing the percentages of the positional relationship between M6A methylated lncRNAs and mRNAs in the two groups. (D) Distributions of fold enrichment of M6A peaks in six categories. Colorectal cancer, CRC; N6-methyladenosine, M6A; tumor-adjacent normal tissues, NC.

