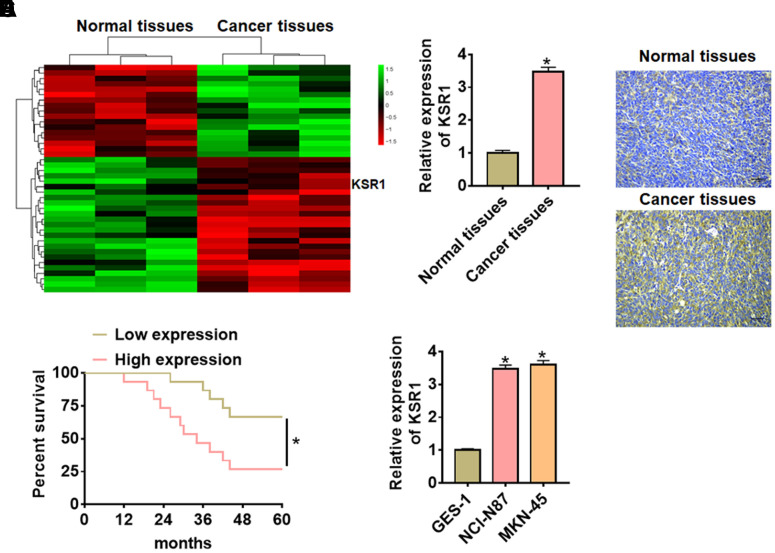
Figure 1.
The expression of KSR1 in GC tissues and cell lines. (A) mRNA expression profiles of normal tissues and cancer tissues in GC. (B) The expression of KSR1 in normal and cancer tissues was detected by qRT-PCR. n = 40. (C) IHC for KSR1 in normal and cancer tissues of GC. Scale bar, 40 μm. (D) According to the median level of KSR1 in Figure 1B, 40 GC patients were divided into low (n = 20) and high expression group (n = 20). Kaplan-Meier curves indicated a 5-year survival rate of GC patients. (E) qRT-PCR analysis for KSR1 level in normal gastric mucosal epithelial cell line GES-1 and GC cell lines (NCI-N87, MKN-45). Data are mean ± SD; *P < 0.05.

