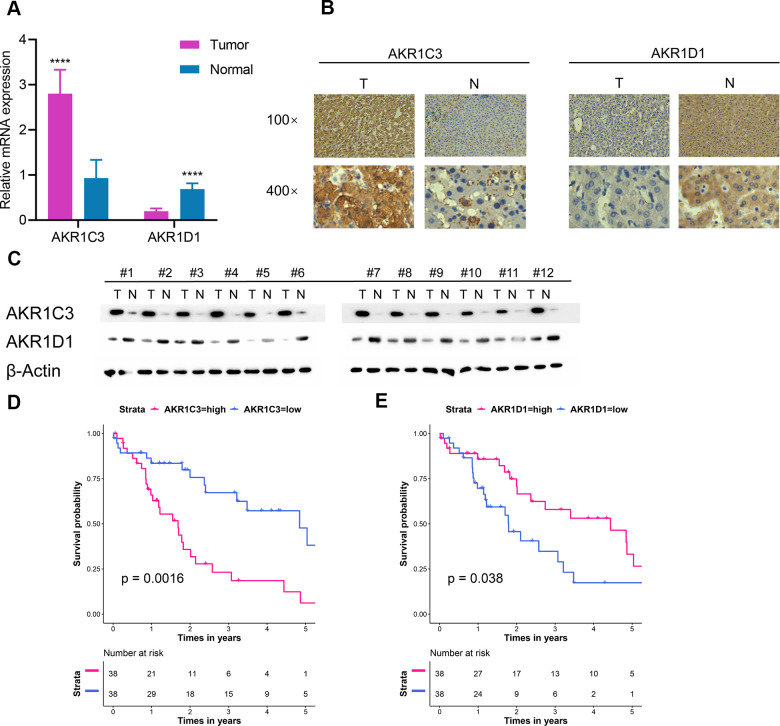
Figure 4.
Extra validation of AKR1C3 and AKR1D1 in the test set. (A) Relative mRNA expression of AKR1C3 and AKR1D1 between tumor and normal. (B) The IHC staining results of AKR1C3 and AKR1D1. (C) The protein level of AKR1C3 and AKR1D1 between tumor and normal tissues. (D) The survival curve of AKR1C3 in the test set. (E) The survival curve of AKR1D1 in the test set.

