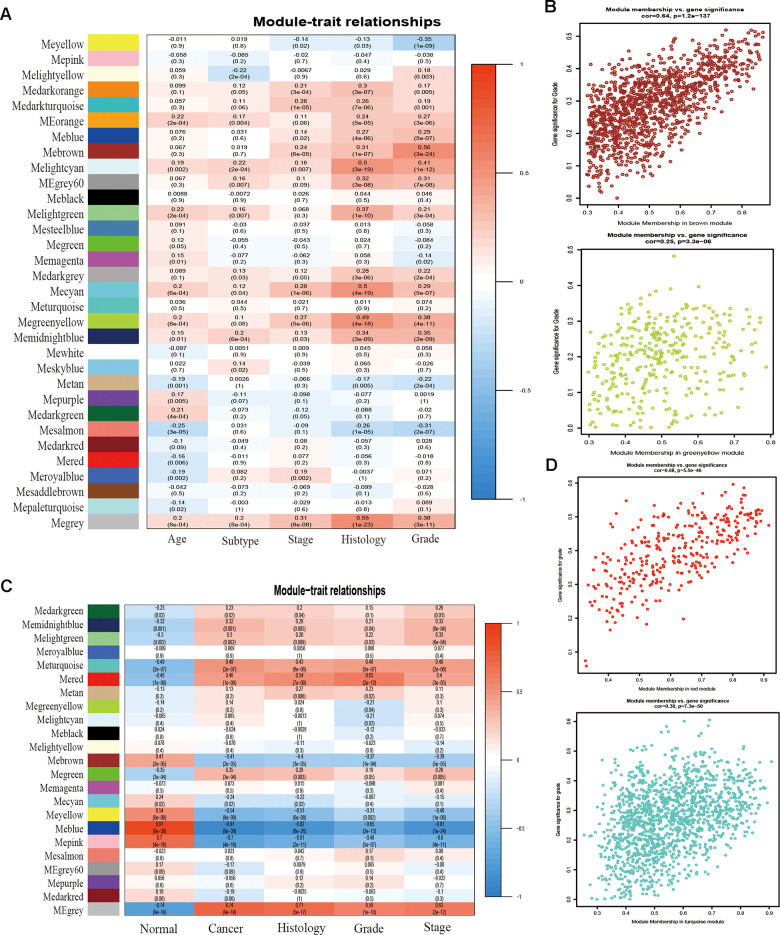
Figure 2.
Correlation between module eigengenes and clinical traits. (A) Correlation between modules and traits of TCGA data. (B) Scatter plots of GS versus the MM in the brown and green-yellow modules of TCGA data. (C) Correlation between modules and traits of GSE17025 data. (D) Scatter plots of module eigengenes in turquoise and red modules of GSE17025.

