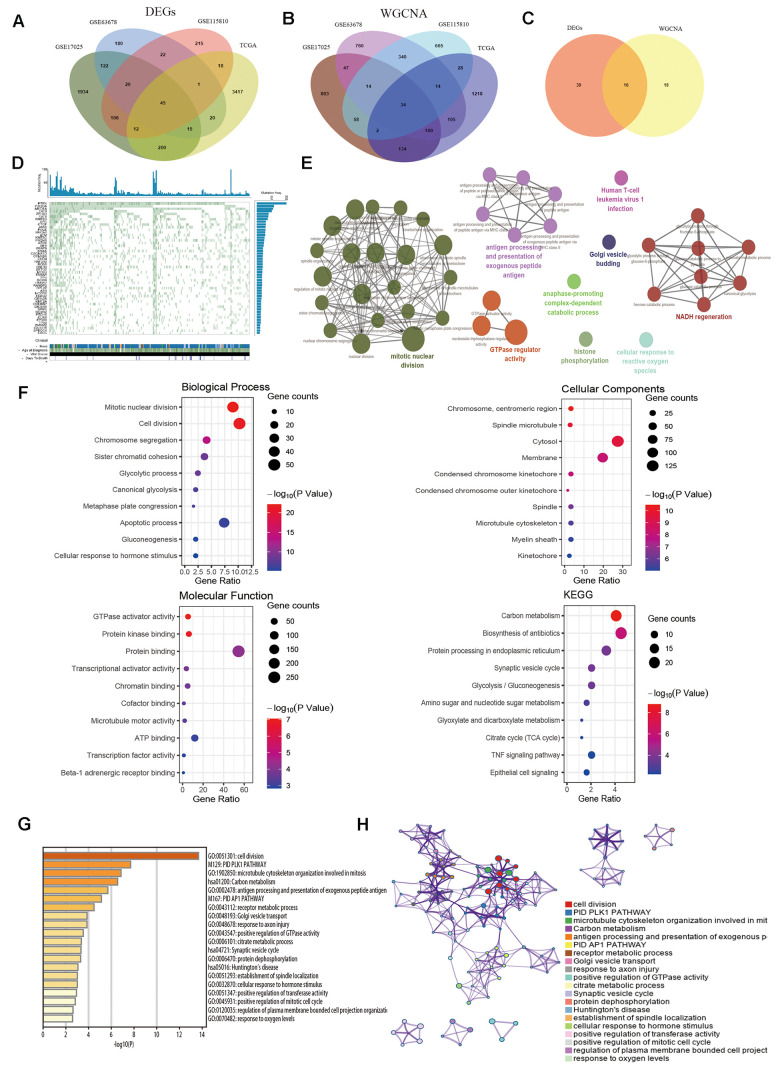
Figure 3.
Identification of common hub genes and functional enrichment analysis. (A) Venn diagram shows the intersection genes of GSE17025, GSE63678, GSE115810 and TCGA-UCEC. (B) Essential genes were found among the selected modules through co-expression network. (C) The intersection common genes of essential genes and DEGs. (D) Top 50 somatic mutated genes in EC. (E) The functional annotation analysis of hub genes was performed by ClueGO and CluePedia. (F) Biological Process (BP) terms, Cellular Component (CC) terms, Molecular Function (MF) terms and KEGG analysis for genes. (G) Boxplot of enriched terms across input gene lists by Metascape, colored by P-values. (H) Network of enriched terms by Metascape.

