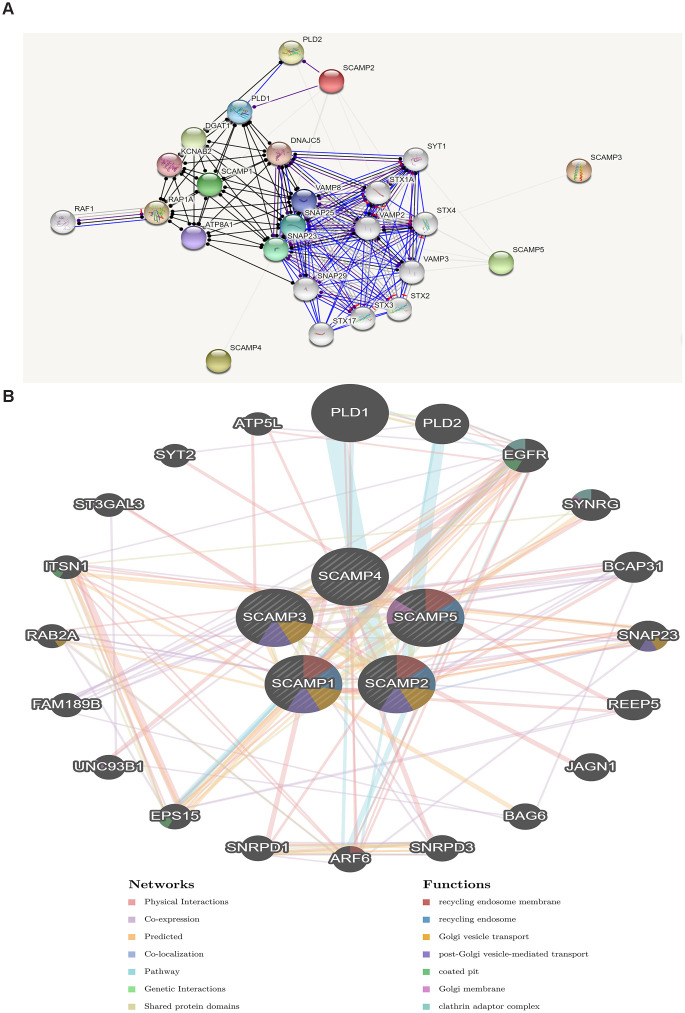
Figure 7.
Protein-protein interaction network of SCAMPs (STRING, GeneMANIA). (A) Functional protein association networks of SCAMPs. Line shape indicated the predicted mode of molecular action. (B) Networks between predicted genes and SCAMP1-5. Different colors of the network edge indicate the bioinformatics methods applied: co-expression, website prediction, pathway, physical interactions and co-localization. Different colors for the network nodes indicate the biological functions of enrichment genes.

