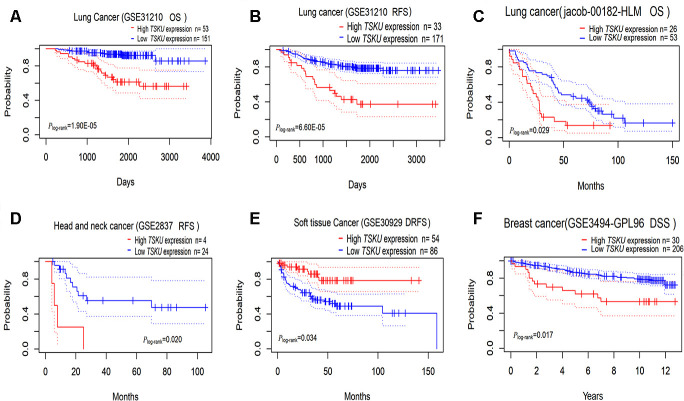
Figure 2.
Kaplan-Meier survival curves comparing high and low TSKU expression levels in different tumors via PrognoScan. (A, B) Survival curves of OS and RFS in the lung cancer cohort (GSE31210, N =204); (C) Survival curves of OS in the lung cancer cohort (jacob-00182-HLM, N = 79); (D) Survival curves of RFS in the head and neck cancer cohort (GSE2837, N = 28); (E) Survival curves of DRFS in the soft tissue cancer cohort (GSE30929, N = 140); (F) Survival curves of DSS in the breast cancer cohort (GSE3494-GPL96, N = 236) OS, overall survival; DSS, disease Specific Survival; RFS, relapse-free survival; DRFS, distant recurrence-free survival.

