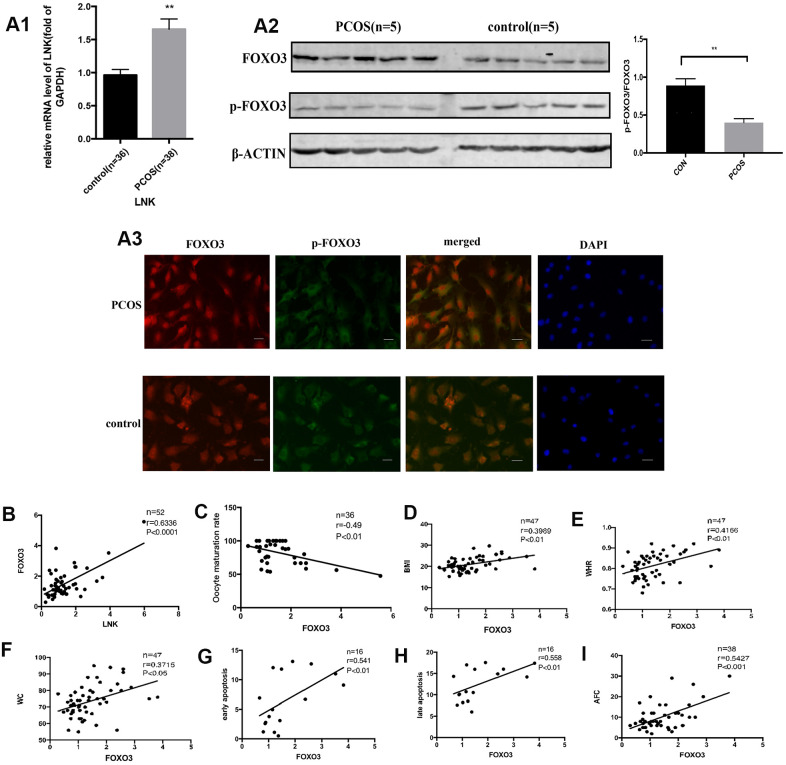
Figure 3.
The expression of FOXO3 in granulosa cells from PCOS and control group, and the relationship between FOXO3 and LNK, apoptosis, IR parameters, and oocyte maturation rate. (A1) RT-PCR results showed a higher mRNA level of FOXO3 in granulosa cells in PCOS group compared with control group. Results are mean±SEM. (A2) Western blot analysis showed that p-FOXO3/FOXO3 level was decreased in PCOS patients compared with control group. Results are mean±SD.*p< 0.05, **p < 0.01 vs. data of control group. (A3) Immunofluorescence staining of granulosa cells showed that in PCOS group, FOXO3 expression was increased in the nucleus compared with control group. Scale bar, 20μm. (B) Pearson correlation analysis showed a positive correlation between LNK (relative mRNA level, fold of GAPDH) and FOXO3 (relative mRNA level, fold of GAPDH). (C) Pearson correlation analysis showed a negative correlation between oocyte maturation rate(%) and FOXO3 (relative mRNA level, fold of GAPDH). (D–F) Pearson correlation analysis showed a positive correlation between FOXO3 (relative mRNA level, fold of GAPDH) and clinical insulin resistance parameters. (G, H) Pearson correlation analysis showed a positive correlation between FOXO3 (relative mRNA level, fold of GAPDH) and apoptosis. (I) Pearson correlation analysis showed a positive correlation between FOXO3 (relative mRNA level, fold of GAPDH) and antral follicle counts.

