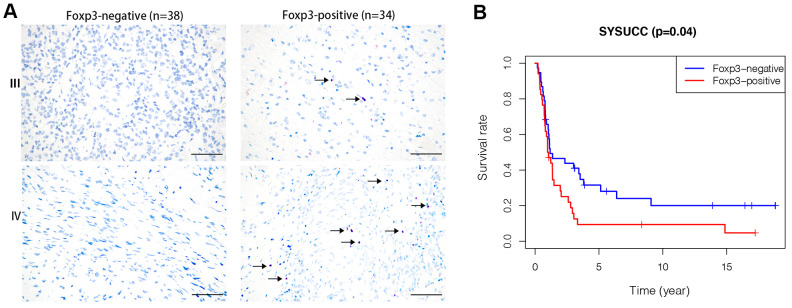
Figure 1.
Foxp3 expression in high-grade gliomas from SYSUCC and survival analysis. (A) Foxp3 expression in 72 high-grade gliomas from SYSUCC, black arrows shows the positive cells. The scale bar represents 50 μm. (B) Comparison of survival prognosis between 34 Foxp3-positive patients and 38 Foxp3-negative patients from SYSUCC (Log-Rank test).

