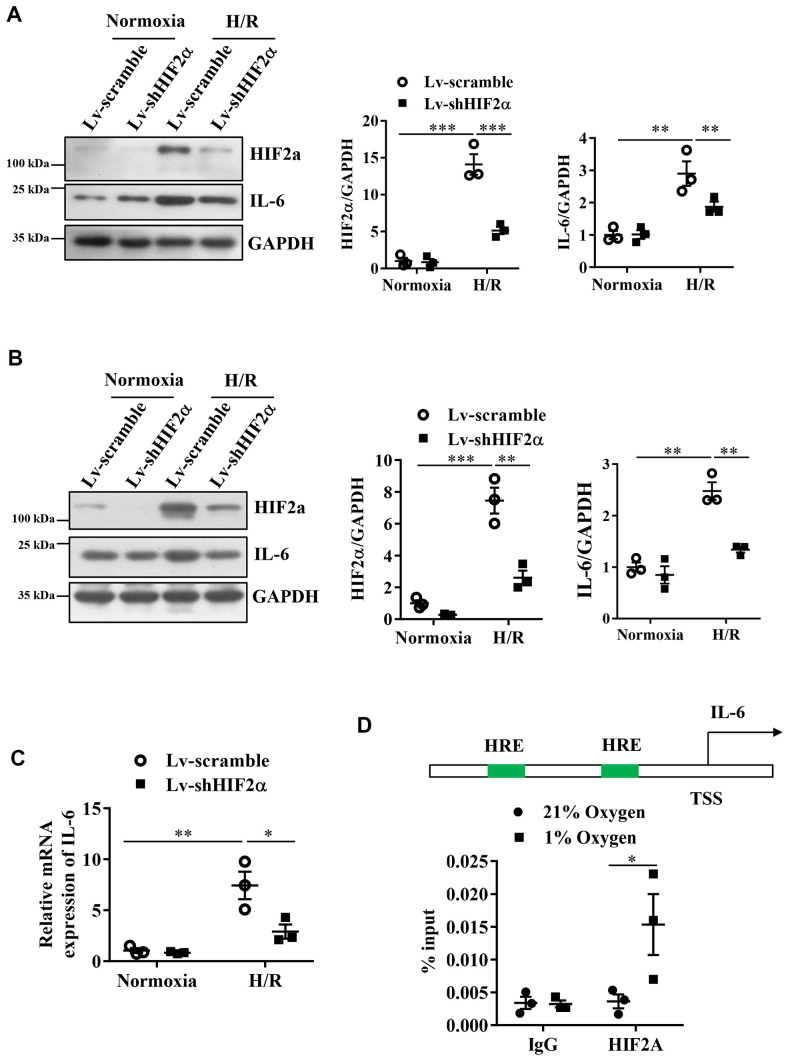
Figure 2.
Expression of IL-6 during the H/R process in cardiomyocytes after knocking down endogenous HIF2α. (A) H9c2 myocardial cell line: Western blot to detect the expression level of IL-6 after knocking down endogenous HIF2α. (B) AC16 human cardiomyocyte line: Western blot to detect the expression level of IL-6 after knocking down endogenous HIF2α. (C) H9c2 cardiomyocyte cell line: qPCR to detect the expression level of IL-6 mRNA after knocking down endogenous HIF2α. (D) The results of ChIP: Diagram of the IL-6 promoter. Quantitative PCR analysis of anti- HIF2α antibody-precipitated and control IgG antibody-precipitated chromatin from cardiomyocytes cultured in 21 or 1% O2. HRE: hypoxia response element. n = 3 per group. Data represent the mean ± SEM. *P<0.05, **P<0.01, ***P<0.001 versus the indicated group.

