Figure 4.
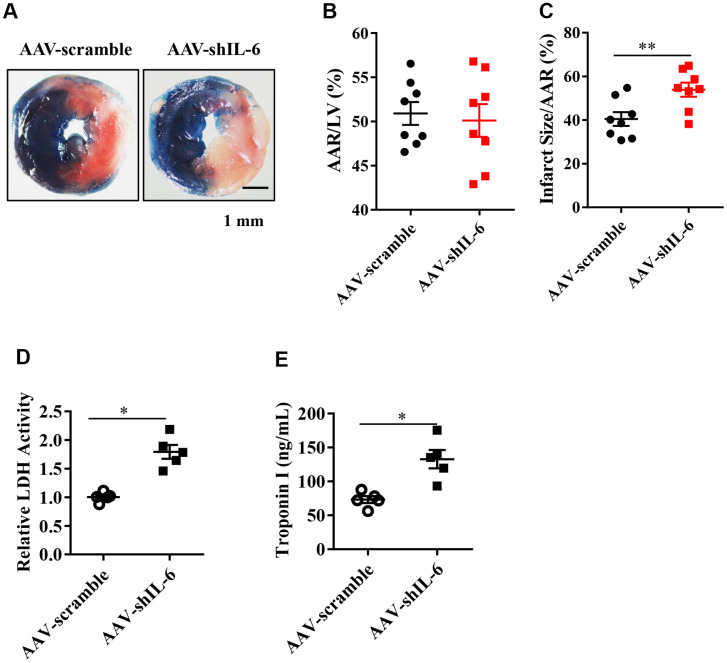
The effect of in vivo IL-6 knockdown on the myocardial infarction area and markers of myocardial injury. (A) TTC and Evans blue staining after mouse heart I/R. (B) Mice in the AAV-scramble group and AAV-shIL-6 group experienced similar cardiac risk areas. n = 8 per group. (C) The range of myocardial infarction in the AAV- shIL-6 group was larger than that in the AAV-scramble group. n = 8 per group. (D) Effect of IL-6 knockdown on the LDH release subsequent to I/R. n = 5 per group. (E) Effect of IL-6 knockdown on the troponin I release subsequent to I/R. n = 5 per group. Data represent the mean ± SEM. *P<0.05, **P<0.01 versus the indicated group.

