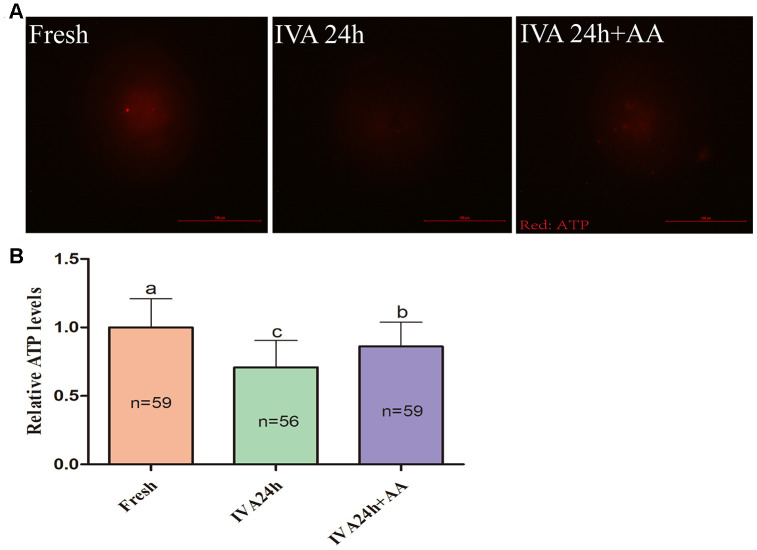
Figure 8.
Effects of AA supplementation on the ATP production of in vitro aged porcine oocytes. (A) Representative fluorescence images of ATP staining in oocytes from each group. Scale bar=100 μm. (B) Relative ATP levels in oocytes from each group. The number of oocytes examined in each group is shown by the bars. Statistically significant differences are indicated by different letters (p<0.05).

