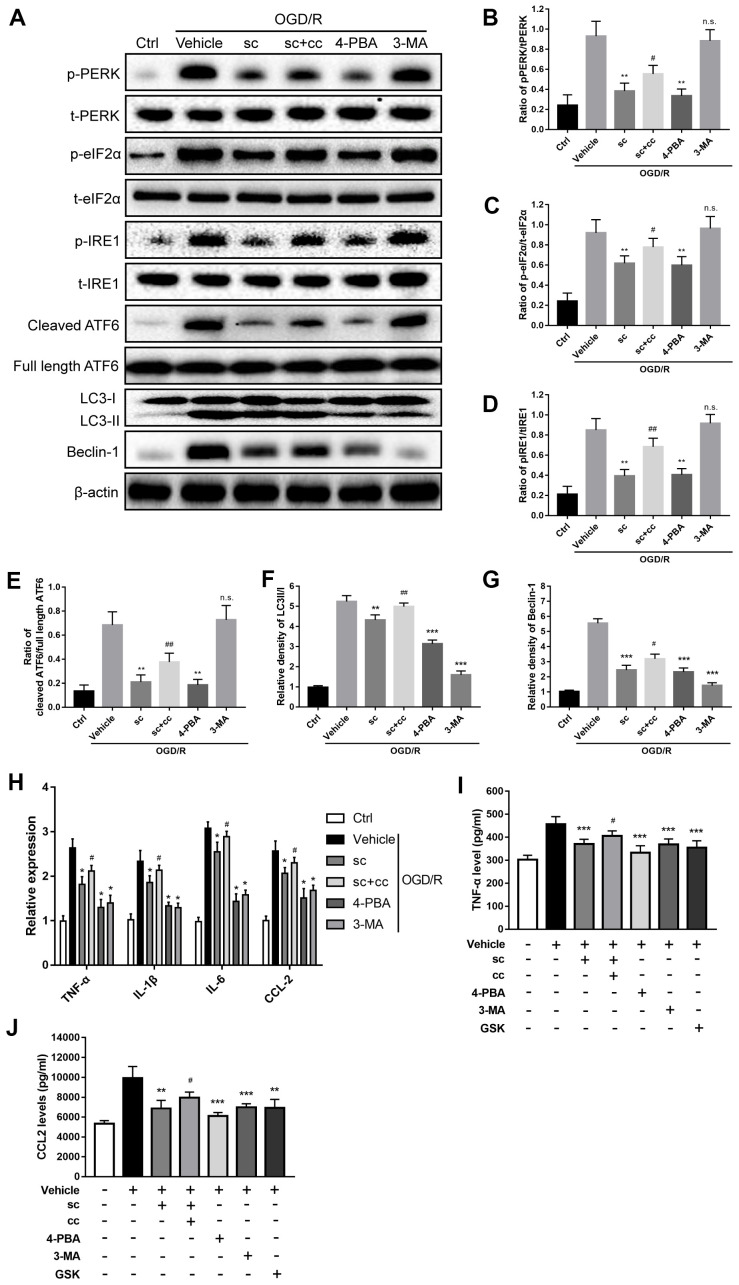
Figure 5.
PTP1B inhibitor mitigated oxygen glucose deprivation/reoxygenation (OGD/R)-induced microglial activation by inhibiting ER stress-dependent autophagy via PERK signaling. (A) The PTP1B inhibitor, sc-222227, 4-PBA, and 3-MA were used to specifically inhibit PTP1B, ER stress, and autophagy in primary microglia, respectively. CCT020312 was used to activate PERK. GSK2606414 was used to inhibit PERK. Western blots were performed to detect p-PERK, PERK, p-eIF2α, eIF2α, p-IRE1, IRE1, cleaved ATF6, full length ATF6, LC-3I/II, and beclin-1 in primary microglia after OGD/R insult. (B–G) Quantitative results of the band density ratio of phosphor-PERK/total-PERK, phospho-eIF2α/total- eIF2α, phospho-IRE1/total-IRE1, and cleaved ATF6/full length ATF6; the relative band density of LC3II/I and beclin-1 are normalized to β-actin. The results are presented as the mean ± SEM (n = 4 per group). (H) Real-time PCR results showing the relative expression of TNF-α, IL-1β, IL-6, and CCL2 in primary microglia in response to treatment with PTP1B inhibitor, PTP1B inhibitor+PERK activator, 4-PBA, 3-MA, and PERK inhibitor after OGD/R insult. Data are normalized to β-actin and presented as the means ± SEM (n = 4 per group). (I, J) ELISA assay to detect expression of secreted TNF-α and CCL2 in primary microglia supernatant 24 h after OGD/R insult. Data are expressed as the means ± SEM (n = 4 per group). *p < 0.05; **p < 0.01; ***p < 0.001 compared with vehicle group; #p < 0.05; ##p < 0.01; ###p < 0.001 compared with the PTP1B inhibitor group; sc = PTP1B inhibitor, sc-222227; cc = PERK activator, CCT020312; GSK = PERK inhibitor, GSK2606414; p-PERK = phospho-PERK; t-PERK = total-PERK; p-eIF2α = phospho-eIF2α; t-eIF2α = total-eIF2α; p-IRE1 = phospho-IRE1; t-IRE1 = total-IRE1; OGD/R = oxygen glucose deprivation/reoxygenation.

