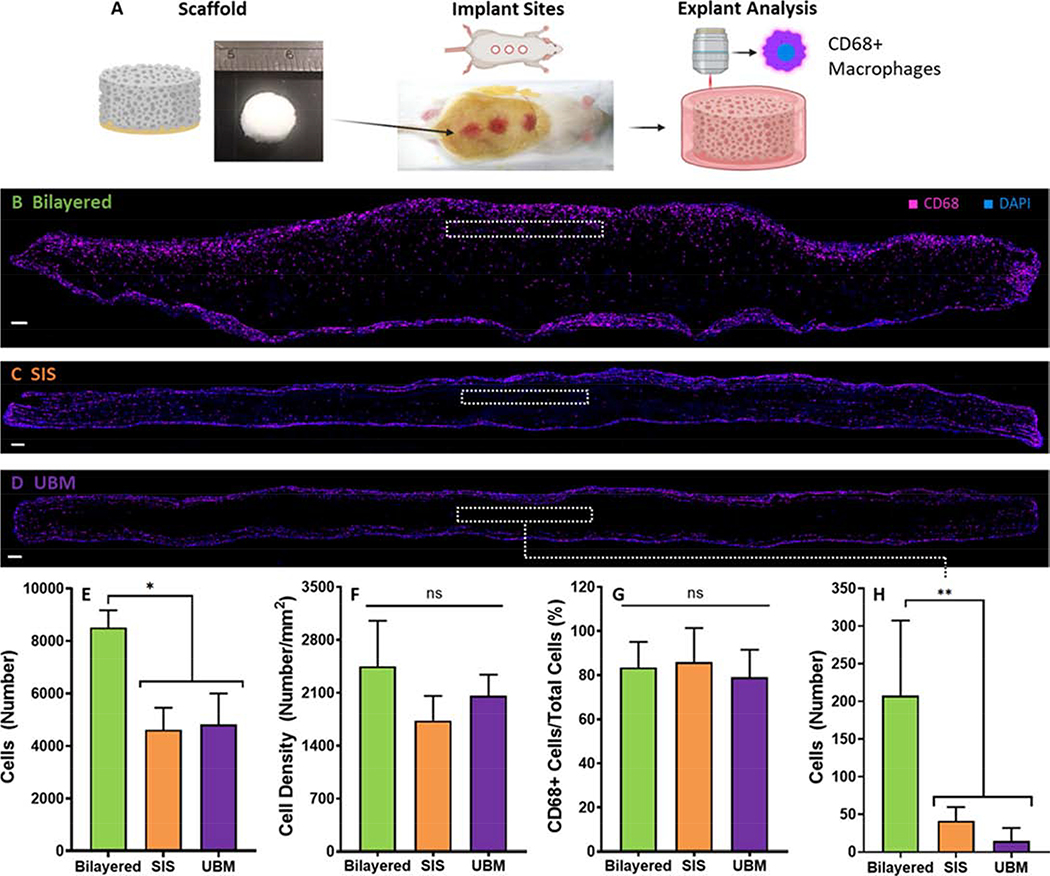
Figure 6:
A Method of implanting the bilayered scaffold and analysing the explanted tissue. B to D) Representative immunofluorescecnt images of the explanted scaffolds. Blue indicates positive DAPI staining and magenta indicates positive CD68 staining. B) Explanted bilayered scaffold C) Explanted SIS scaffold. D) Explanted UBM scaffold. E) The number of cells that infiltrated each scaffold type following subcutaneous implantation in a rat model. F) The cellular density of each scaffold type. G) The ratio of CD68+ cells to the total number of cells present in the explants. H) The number of cells that infiltrate a 0.1mm2 area of interest at a distance of 100 μm from the scaffolds upper face (depicted by the inset dashed line boxes in B to D). Error bars depict 1 standard deviation from the mean. Scale bars depict 100 μm. * indicates significance at p < 0.05.

