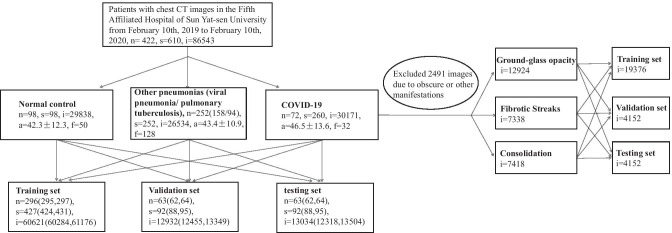
Fig. 1.
Datasets diagram. The data splitting is based on the subjects in the COVID-19 recognition experiment (left), while it is based on the images for the COVID-19’s manifestation classification experiment (right). {n, s, i, a, f} denote the numbers of {subjects, studies, images, mean age ± sd, number of females}, respectively. Values in parentheses are the floating bands

