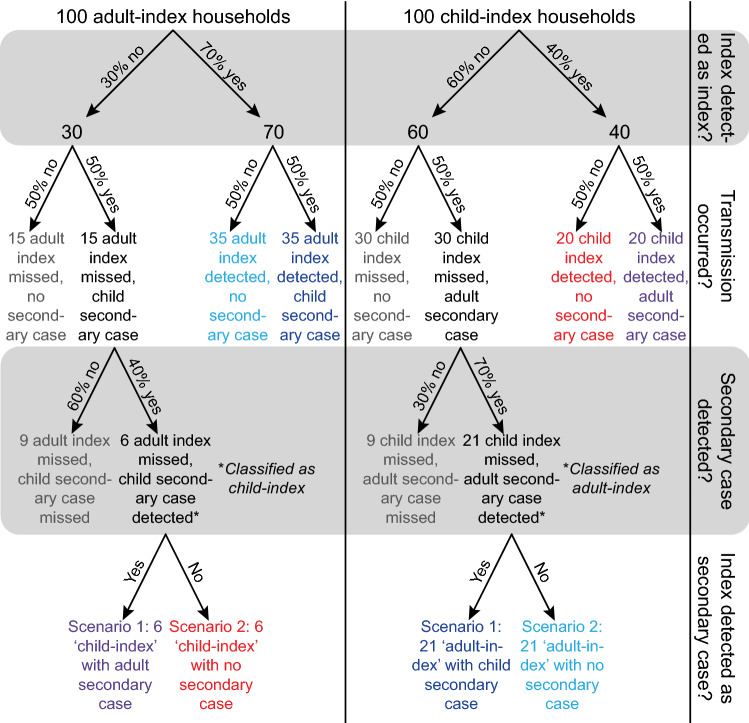
Fig. 10.
Illustration of differential detection of infection in adults and children. Flowcharts of infection and detection are presented in the diagram. Households shown in the same colors represent the same results, no matter whether they are true or misclassified. Households in grey remain completely undetected. We consider a simplified example for intergenerational household transmission; all households are composed of one adult and one child, so that the only transmission opportunity is to one individual of the other age category. We use 100 households with an adult index case (left column), and 100 households with a child index (right column). This scenario is drawn under the null hypothesis of equal infectiousness of adults and children, and both age groups transmit the infection half (50%) of the time. The only difference between infected adults and children is the probability that they are detected, reflecting differential symptom presentation. We assume that 70% of adults and 40% of children are detected (the numbers chosen are illustrative and the key information is that adults are more likely to be detected). Additionally, we assume that testing works perfectly (i.e., all contacts are tested and identified accurately) and no testing is triggered by contacts outside of the household. We consider two scenarios when an index case is missed and their secondary case is detected. In both scenarios the secondary case is falsely considered to be the index case and the true index is tested as a potential secondary case. In scenario 1, the true index can still be detected and will falsely be considered a secondary case of the false index. In scenario 2, the true index can no longer be detected and the false index will be considered to have not infected anyone. The SARs under both scenarios are calculated in Table 1, which shows that the differential detection of infections in adults and children creates a bias that can go in either direction. Under scenario 1, the SAR is higher for adult indices than for child indices, while for scenario 2 the SAR is higher for child indices than for adult indices

