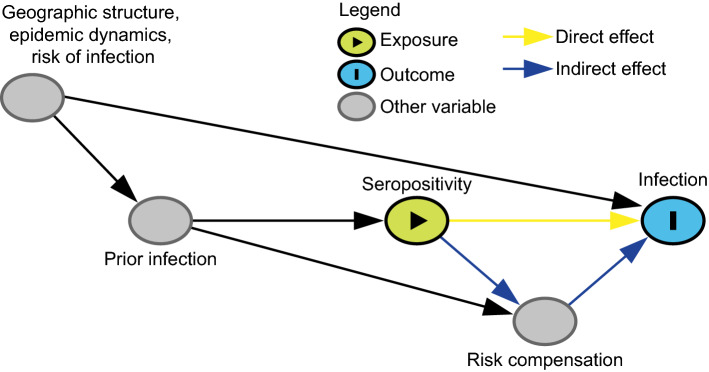
Fig. 4.
Directed acyclic graph under the alternative hypothesis showing confounding in the estimation of seroprotection. This figure shows the causal relationship between important variables that influence the infection status of an individual. To analyze the effect of seropositivity on the risk of infection, we would need to adjust for geographic structure, epidemic dynamics, the risk of infection and any other variables that are confounders of this exposure-outcome relationship. The effect of seropositivity on infection risk may be mediated by behavior change (induced by knowledge of serostatus) that affects the risk of infection. Disentangling direct (biological) effects of seropositivity and indirect effects through risk compensation is not straight-forward. Geographic structure, epidemic dynamics, and risk of infection are likely or guaranteed confounders of the relationship between seropositivity and future infection. For the purposes of illustrating this particular bias, the directed acyclic graph is drawn under the strong assumption of no additional unmeasured confounding; however, a study of seroprotection, like any observational study, may have other common causes of the exposure (seropositivity) and the outcome (future infection) and it is important to think carefully about additional confounders given unique study settings and designs

