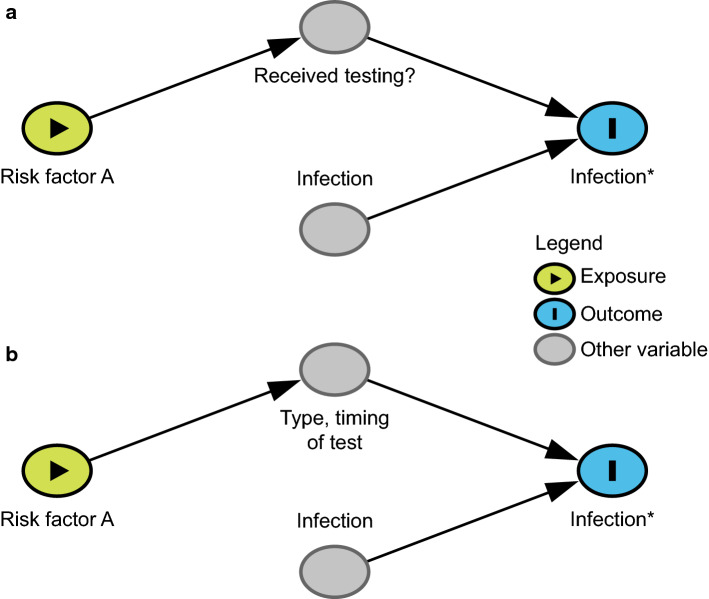
Fig. 6.
Directed acyclic graph under the null hypothesis showing differential misclassification by a whether an individual is tested and b the timing or type of test. A study is trying to determine the relationship between Risk Factor A and observed infection status (Infection*), where observed infection status is a proxy for the variable of interest, true infection status (Infection). If (a) Risk Factor A influences whether someone is tested and all non-tested individuals are assumed to be uninfected or (b) Risk Factor A affects the type of test and timing of testing conducted then under the null hypothesis of no effect of Risk Factor A on COVID-19 rates misclassification can cause upward or downward bias. The figures are simplified to illustrate these particular biases, and therefore make the strong assumption of no additional unmeasured confounding (i.e., no common causes of any two variables in the figure)

