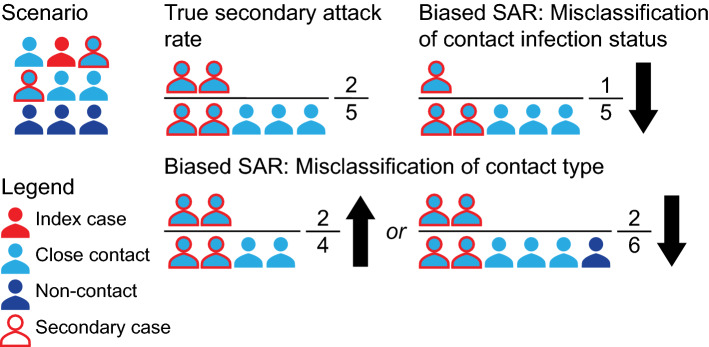
Fig. 9.
Illustration of misclassification of contact type and contact infection status. As shown in the top left, an infected individual infects some of their close contacts. The true SAR is represented in the top middle; the infected contacts are in the numerator and all close contacts are in the denominator. Bias due to misclassification of contact type can go in both directions. Bias is in the upward direction if some close contacts are missed during contact-tracing (bottom middle), and in the downward direction if non-close contacts are falsely considered as close contacts (bottom right). Misclassification of contact infection status can happen when close contacts are not appropriately tested or followed-up and creates downward bias (top right)

