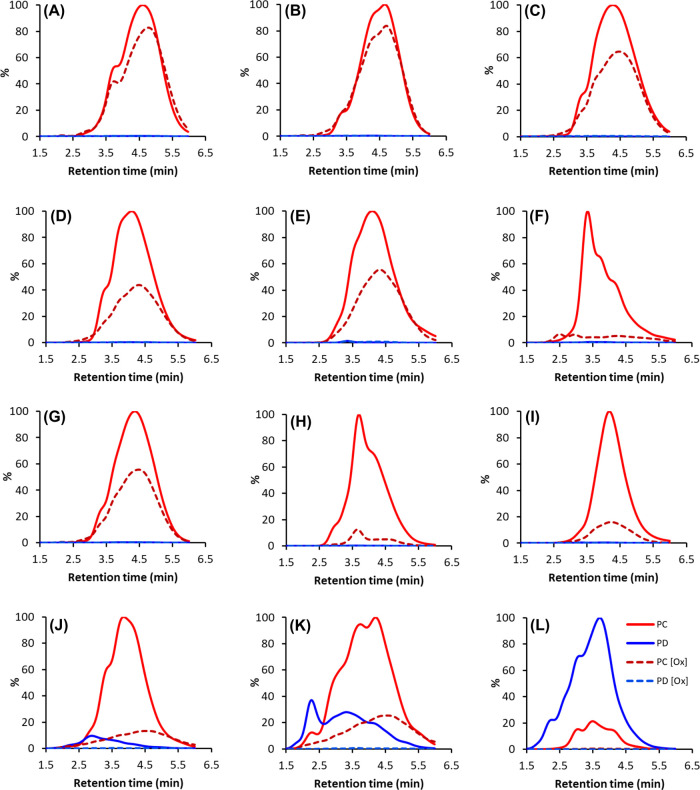
Figure 3.
Examples of UHPLC–DAD–MS/MS fingerprints of the studied plant samples in categories A and B before and after oxidation obtained using the Engström method. The solid red lines are PC units detected before oxidation, red dashed lines are PC units detected after oxidation, solid blue lines are PD units detected before oxidation, and blue dashed lines are PD units detected after oxidation. Shown plant species are as follows: (A) Mandevilla splendens leaves (2), (B) Osteomeles schweriniae flowers (80), (C) Pavonia cauliflora flowers (52), (D) Alpinia purpurata leaves (101), (E) Polystichum proliferum leaves (33), (F) Camellia japonica leaves (93), (G) Encephalartos ferox leaflets (98), (H) Aglaonema crispum leaves (4), (I) Coffea arabica leaves (82), (J) Acca sellowiana leaves (56), (K) Psidium cattleianum leaves (60), and(L) Pelargonium odoratissimum leaves (48). The sample numbers refer to Table 1.

