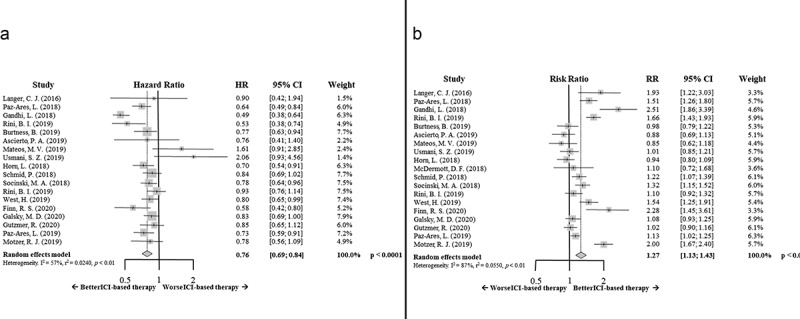
Figure 3.

Forrest plot diagrams: Hazard ratio (HR) with 95% confidence interval (CI) for overall survival between arms (a); Risk ratio (RR) with 95% CI for overall response rate between arms (b)

Forrest plot diagrams: Hazard ratio (HR) with 95% confidence interval (CI) for overall survival between arms (a); Risk ratio (RR) with 95% CI for overall response rate between arms (b)