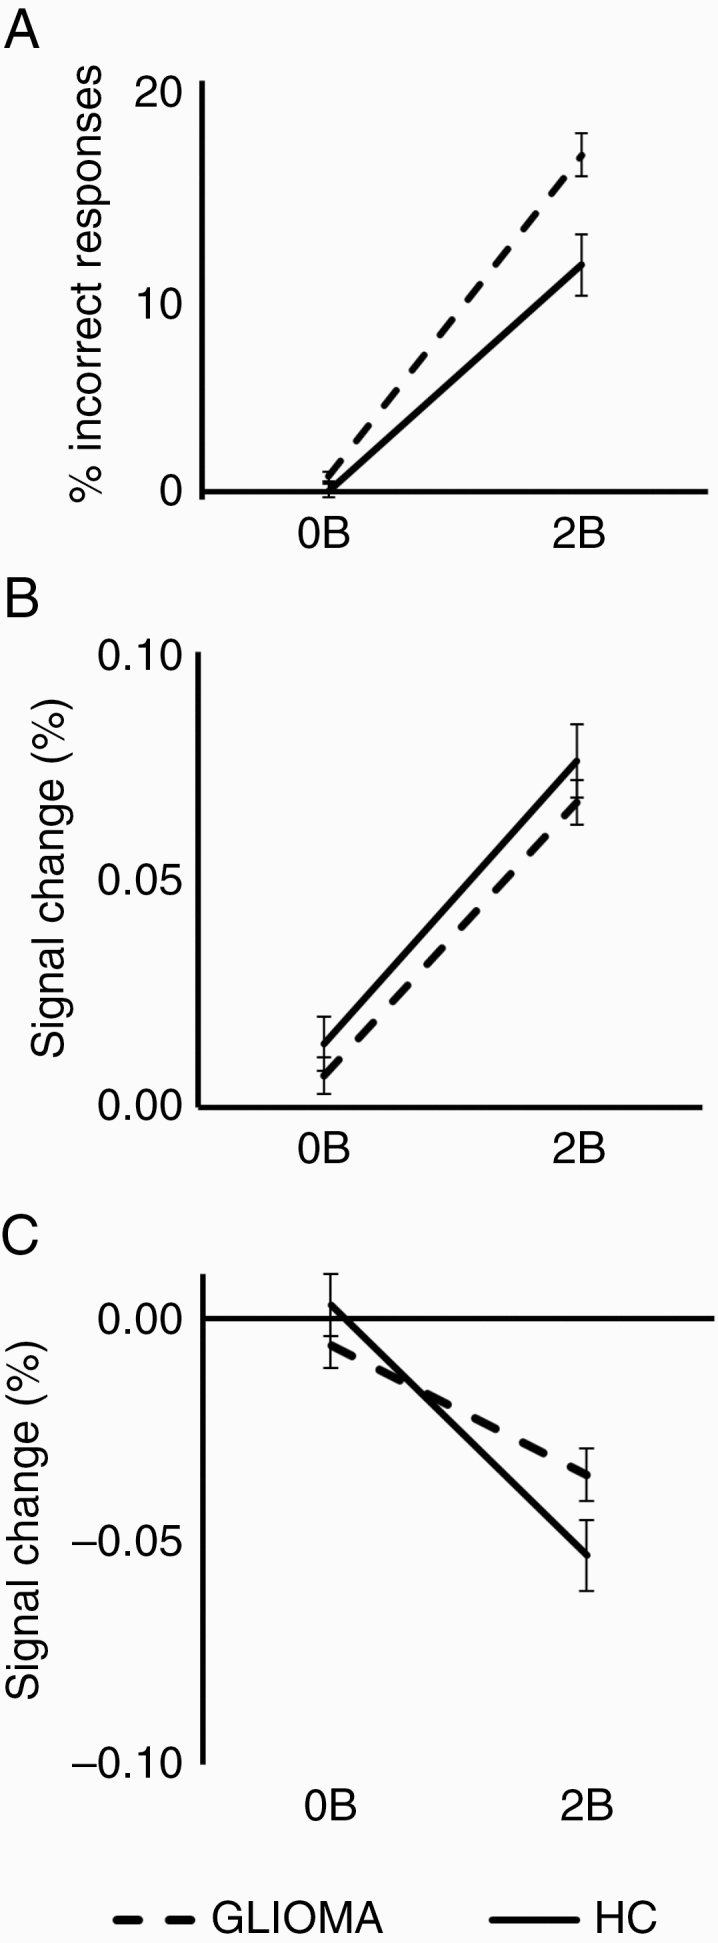
Figure 3.

Task performance and brain activity measures of healthy controls (HC, solid line) and glioma patients (GLIOMA, dashed line) are presented here for the 0-back (0B) and the 2-back (2B) condition. Age-corrected results are presented by showing results for the mean age of all participants (mean age = 45.6 years). A, The percentage of incorrect responses (false alarms and missed targets combined) are shown (± SEM) for each group. Taking age into account, glioma patients showed reduced task performance compared to HCs. C and D, Signal change within the central executive network (CEN, C), and the default mode network (DMN, D) are shown (± SEM). Note the similar increase in activity within the CEN for HCs and glioma patients with increasing task difficulty. For the DMN, patients show reduced deactivation during 2B.
