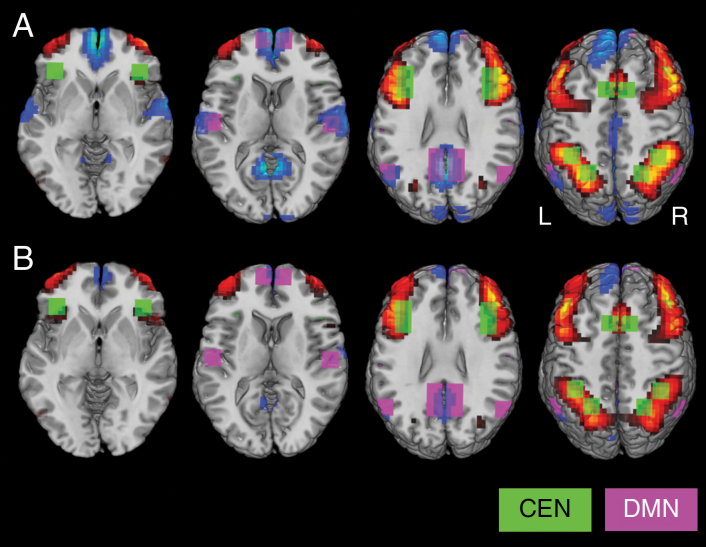
Figure 4.
Illustration of the brain activity patterns induced by the N-back task for A, healthy control group (HC), and B, glioma patients (GLIOMA). The contrast between the 2-back and 0-back task condition is presented here. Voxels in which the brain activity exceeded the threshold value of b = 0.05 are indicated in red, whereas voxels in which the brain activity was below the threshold value of b = –0.05 are indicated in blue. Regions of interest (ROIs) are superimposed on the brain activity patterns (CEN, in green; DMN, in purple). Note that the positive brain activity patterns are quite similar between groups within CEN, whereas glioma patients show less negative brain activity compared to the HC group within the DMN.

