
FIGURE 4.
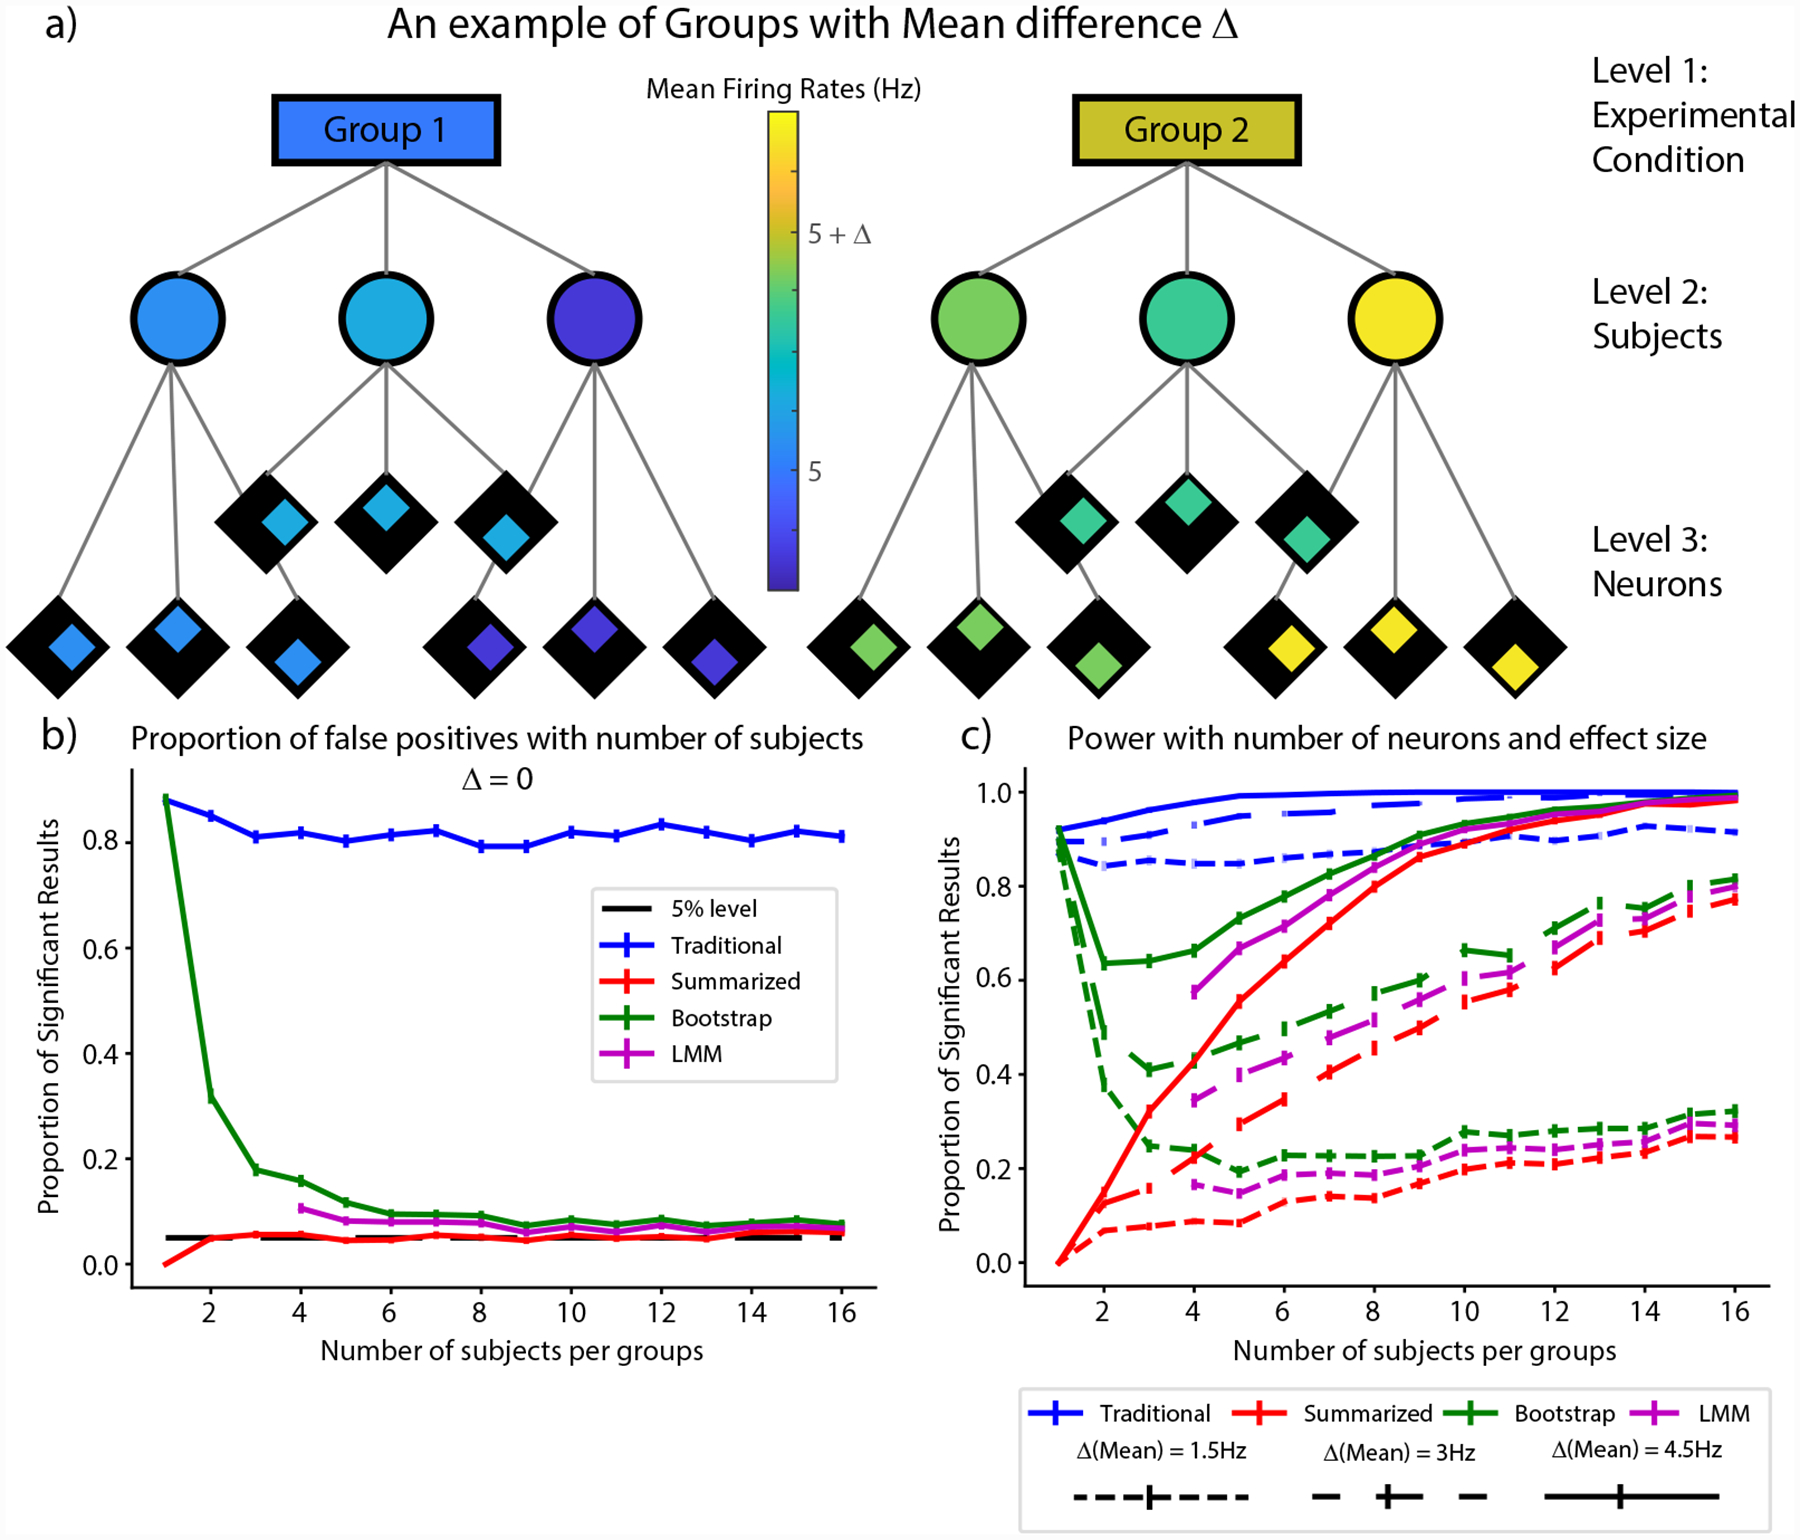
Change of power with number of neurons and effect size. a) A graphical representation of the experimental conditions. As shown, there is now a difference in the mean between groups with individual subjects also displaying variations about the mean. b) The false positive rate when there was no difference between the mean firing rates for the two groups. c) The proportion of significant results or power when the difference in mean firing rates (Δmean) between the two groups was 1.5Hz (short dashes), 3Hz (long dashes) and 4.5 Hz (solid line) respectively.