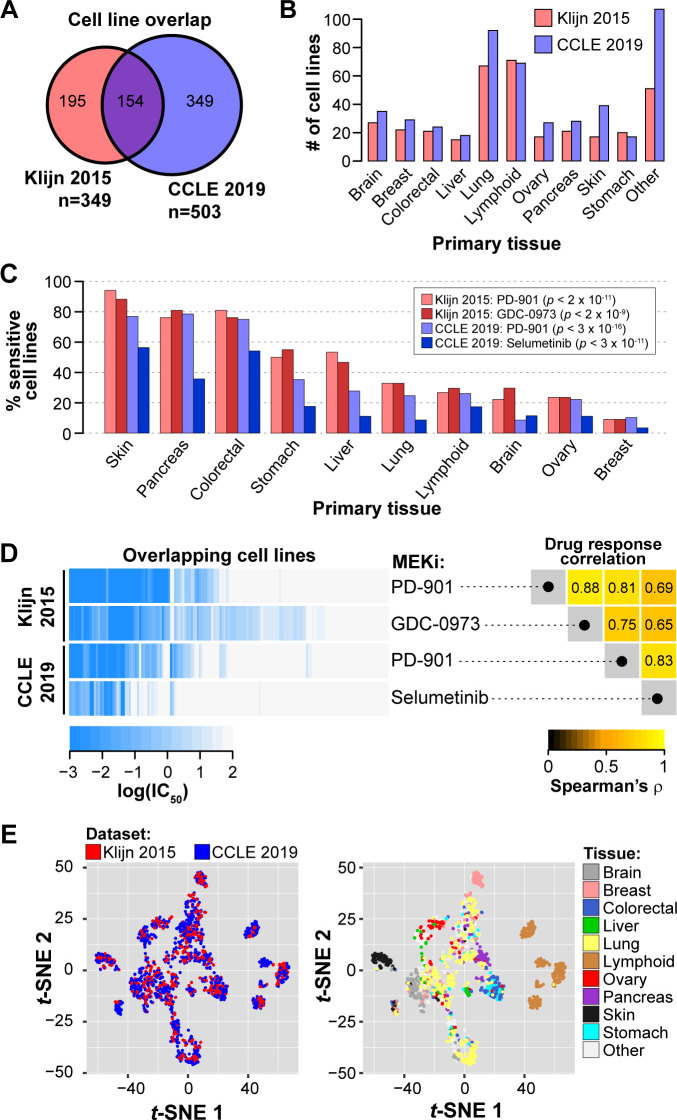
Fig 1. Overview of between-cancer type differences of MEK inhibitor response and expression patterns in the Klijn 2015 and Cancer Cell Line Encyclopedia datasets.
(A) Overlap in cell lines with drug response and RNA expression and DNA variant data. (B) Counts of tumor cell lines with MEKi response data for 10 shared cancer types (n ≥15 in both datasets). (C) Proportion of MEKi-sensitive cell lines stratified by tissue. Cell lines were considered sensitive based on a threshold of IC50 ≤ 1 nM. P-values from χ2 test of independence of sensitive vs. resistant cell line proportions across the 10 tissues. (D) Variability in the response to the MEK small molecule inhibitors. Left: Heatmap of MEKi response in log(IC50) for four data series (in rows). Each column corresponds to a single cell line with drug response data for both MEKi in both datasets; columns were hierarchically clustered. Right: Rank correlation of log(IC50) among the four data series in the left panel. (E) Scatterplots of the first two dimensions from t-distributed stochastic neighbor embedding (t-SNE) analysis on transcriptome data. Each point represents a cell line and is colored by dataset (left) and tissue-of-origin (right).

