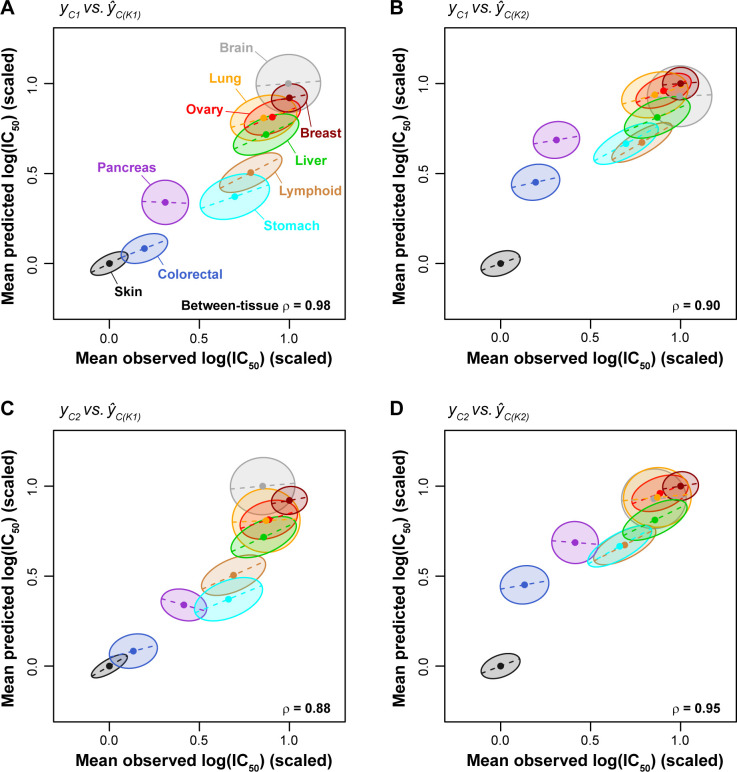
Fig 3. Cigar plots of pan-cancer MEKi response predictions within and between cancer types.
Dots at the center of ellipses indicate the mean observed and predicted log(IC50) values for a given tissue (mean values were scaled linearly between 0 and 1). ρ values indicate rank correlation among centers of ellipses. Maximum ellipsis length scales with the range of MEKi responses for a given tissue, where tissues with larger response ranges are associated with longer ellipses (e.g. stomach and lymphoid) while tissues with a smaller response range are associated with shorter ellipses (e.g. skin and breast). The slope of dashed lines (and tilt of ellipses) corresponds to the within-tissue regression coefficient of the predicted values against the observed values (Pearson’s r). The width of ellipses also corresponds to the within-tissue regression coefficient, i.e., a high correlation value is shown as a slender ellipse while a low correlation value leads to a round ellipse. (A-D) Within- and between-tissue performances for the 4 combinations of drug/models trained on Klijn 2015 data and applied to CCLE data.

