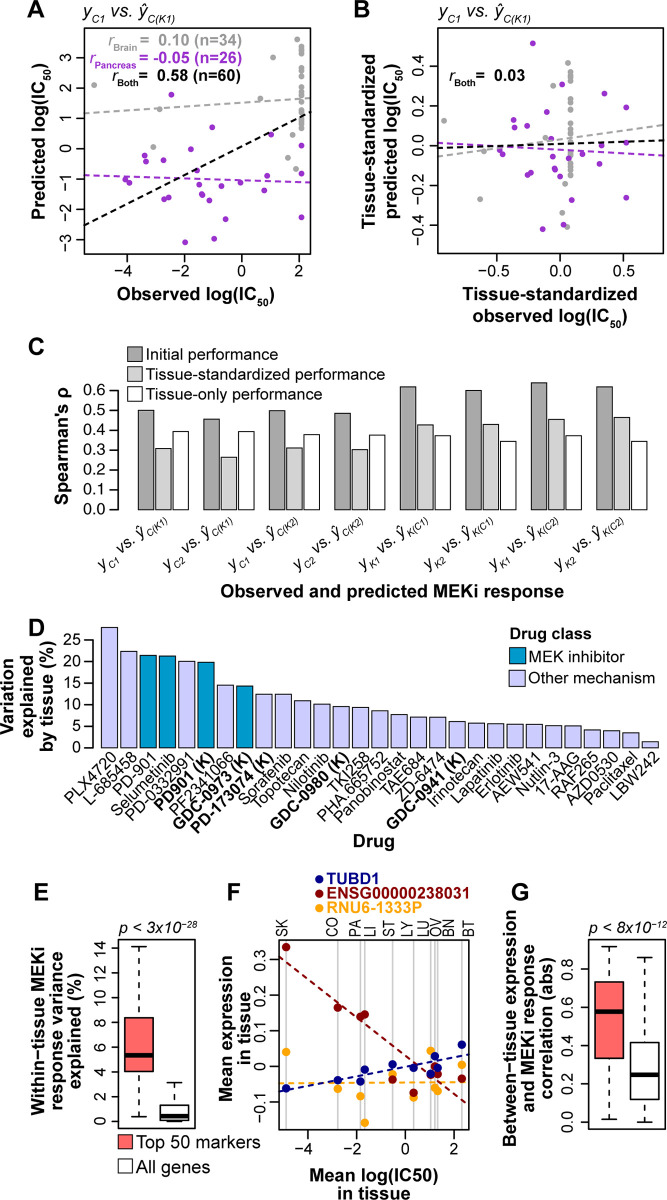
Fig 4. Effects of between-tissue signals on prediction performance and biomarker importance.
(A) Performance of pan-cancer prediction models for a combination of brain and pancreas tissues. Correlation (Pearson’s r) is shown for brain cell lines (gray), pancreas cell lines (purple), and both brain and pancreas combined (black). Dashed lines indicate lines of best fit. (B) Performance of pan-cancer prediction models for a combination of brain and pancreas tissues following standardization of observed and predicted MEKi response within tissues. Standardization was performed by scaling linearly between 0 and 1 and subtracting the scaled mean. (C) Comparisons of initial performance (dark gray bars; Fig 2D), performances calculated following standardization of observed and predicted log(IC50) values within tissues (light gray bars), and performances of tissue-only predictions (white bars) for regularized regression models. (D) Variation in drug response explained by tissue for the 29 drug screens in the Klijn 2015 (n = 5; bold and suffixed with “(K)” on x-axis) and CCLE 2019 (n = 24) datasets. Variation explained was calculated with analysis of variance (ANOVA) on a linear model of log(IC50) ~ tissue. (E) Within-tissue variation in drug response explained by gene expression for the top 50 RNA biomarkers (pink) and all genes (white) for the fK1 regularized regression model. P-value from a Mann-Whitney U test. (F) Example correlation between mean log(IC50) and mean expression levels within tissues for three of the top 50 markers (red, blue, orange) for the fK1 regularized regression model. Dashed lines indicate lines of best fit for the color-matched points. Vertical gray lines denote mean log(IC50) values for the 10 tissues, which are abbreviated at the top of the plot: SK: skin, CO: colorectal, PA: pancreas, LI: liver, ST: stomach, LY: lymphoid, LU: lung, OV: ovary, BN: brain, BT: breast. (G) Absolute (abs) correlation between mean log(IC50) and mean gene expression across 10 tissues for the top 50 RNA biomarkers (pink) and all genes (white) for the fK1 regularized regression model. P-value from a Mann Whitney U test.

