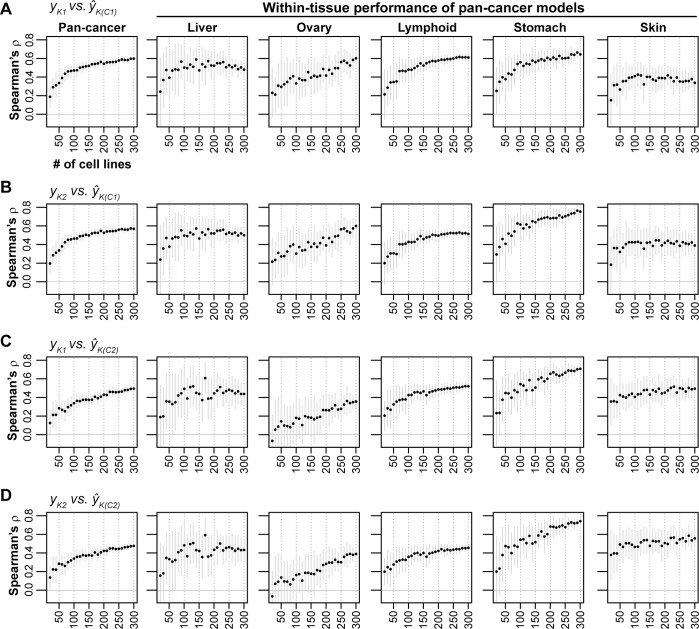
Fig 6. Performance of pan-cancer MEKi response predictions based on downsampled sets of cell lines.
Downsampled pan-cancer models were applied, from left to right, on pan-cancer testing sets and five single-tissue testing sets. Cell lines in the CCLE dataset were randomly downsampled to sample sizes ranging from 20 to 300 in 10 cell line increments (x-axis; niterations = 30). Regularized regression prediction models were trained on downsampled cell lines sets and applied to cell lines in the Klijn 2015 dataset. Mean ranked correlation (Spearman’s ρ) between observed and predicted logged IC50 values across the 30 iterations for each sample size are plotted. (A-D) Results are shown for the 4 combinations of drug-models trained using CCLE data and applied to Klijn 2015 data. Solid gray vertical lines: ±standard deviation.

