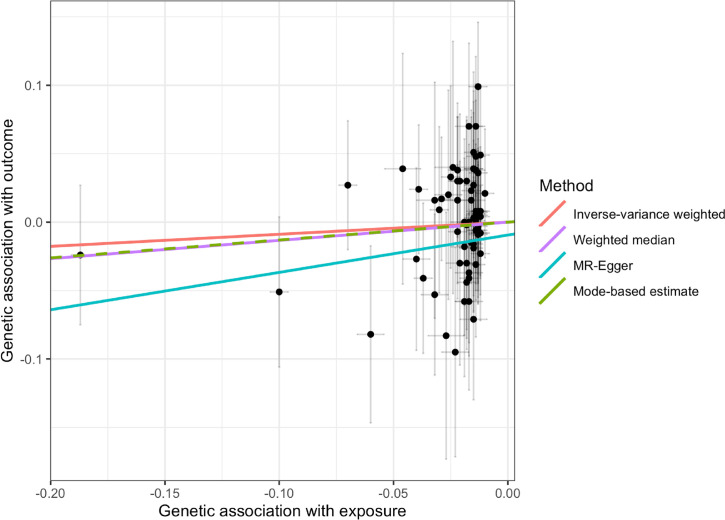
Fig 3. Scatter plot of the main MR study investigating the effect of 25OHD on type 1 diabetes.
The x-axis represents the genetic association with 25OHD levels; the y-axis represents the genetic association with risk of type 1 diabetes. Each line represents a different MR method. 25OHD, 25-hydroxyvitamin D; MR, Mendelian randomization.

