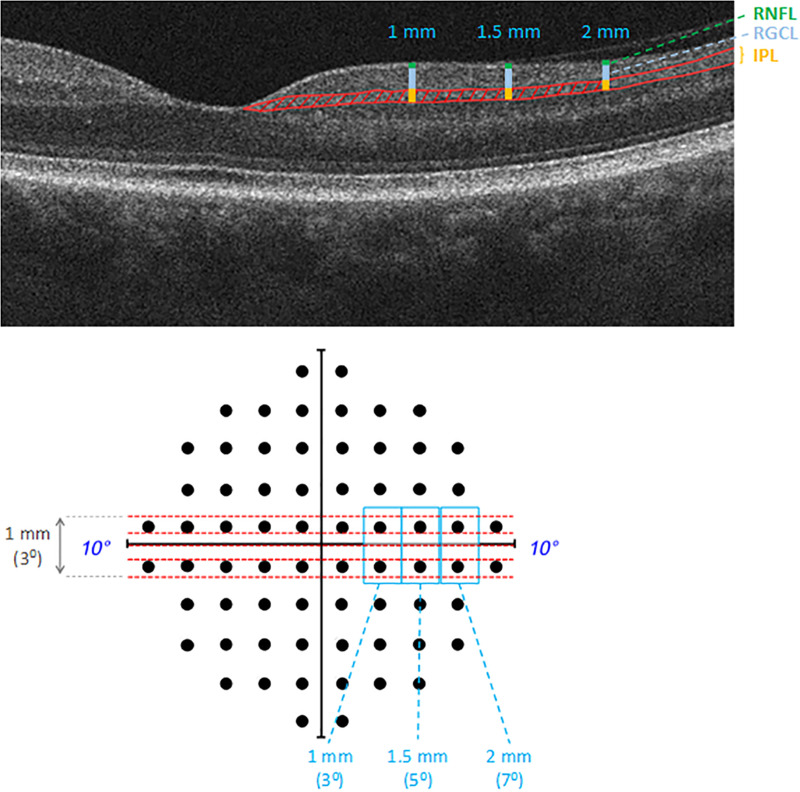
Fig 1. Studied imaging parameters of the IPL for testing functional associations.
The imaging parameters analyzed on OCT scans included the thickness of the IPL (shown by yellow bar), RGCL (shown by blue bar), and RNFL (shown by green bar) on the nasal and temporal sides at a distance of 1, 1.5, and 2 mm from the center of the macula (shown is the nasal side). The IPL was also analyzed in the same retinal locations by linear densitometry. In addition, the IPL density was analyzed in the area within 2 mm (approximately 70) from the macula center on nasal and temporal sides of the OCT scans (red patterned area). For testing the functional association of these imaging parameters, corresponding total deviation values on 10–2 visual fields were used, including one below and one above the horizontal midline within 80 (shown in blue-colored boxes) on nasal and temporal fields. Red dashed lines illustrate the approximate position of 5-line raster scans that were obtained within a 6×1 mm2 area, the vertical span of which (1 mm) corresponds to an angular spacing of approximately 30. The thickness and linear densitometry values obtained at 1, 1.5, and 2 mm from the macula center on these scans were tested against the average of total deviation scores at corresponding test points (approximately 3, 5, and 70); however, the area densitometry values were tested against the average of these values.

