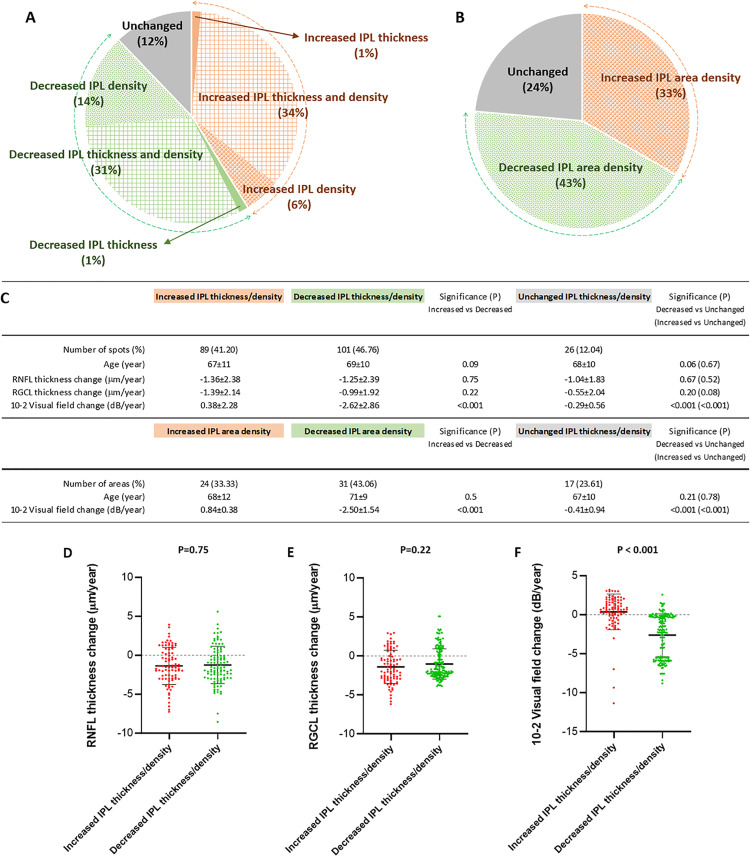
Fig 4. Distribution and associations of IPL alterations in patients with glaucoma.
The pie graphs in panels A and B show the distribution of analysis locations with or without alterations in IPL imaging parameters over the two-year follow-up. These IPL alterations reflect those beyond the 95% confidence intervals of the change that was estimated by GEE. As shown in panel A, both the IPL thickness and the linear density increased at 74 (34%; red box-patterned area) analysis locations out of 216; while only the IPL thickness increased at 3 (1%; red area) or only the IPL density increased at 12 (6%; red dotted area) analysis locations. In contrast, at 67 analysis locations (31%; green box-patterned area), both the IPL thickness and the linear density decreased, while only the IPL thickness decreased at 3 (1%; green area) or only the IPL density decreased at 31 (14%; green dotted area) analysis locations. In 26 analysis locations (12%; gray area), the IPL thickness or density did not change significantly. As shown in panel B, the area density of the IPL (analyzed within 2 mm from the center of the macula on nasal and temporal sides) increased at 24 (33%; red area), decreased at 31 (43%, green area), or unchanged at 17 (24%; gray area) out of 72 analysis locations. Accompanying table (C) presents the RNFL thickness, RGCL thickness, and 10–2 visual field total deviation scores (mean±SD) for the analysis locations exhibiting increased (41%), decreased (47%), or unchanged (12%) IPL thickness and/or density, as shown in panel A. Vertical scatterplots show data distribution for RNFL thickness (D), RGCL thickness (E), and 10–2 visual field total deviation (F) in the subgroups with IPL alterations in different directions.

