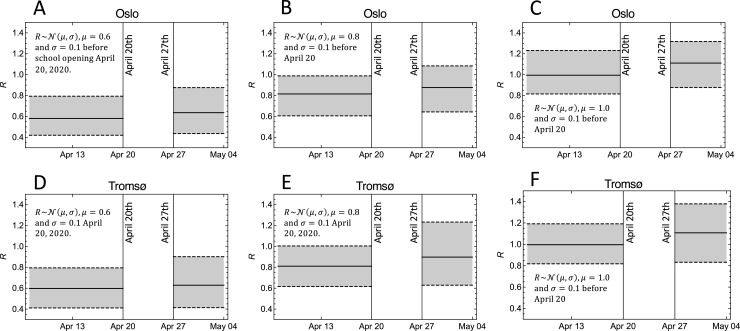
Fig 2. The effect of school opening on the estimates of the basic reproduction number R under different assumptions on the value before school opening.
The solid lines are the weighted medians, and the dashed lines show weighted 95% CI. A: The model ensemble for the city of Oslo weighted by a normal distribution with mean 0.6 and standard deviation 0.1 for the reproduction number prior to April 20. B: As (A) but weighted by a normal distribution with mean 0.8 and standard deviation 0.1. C: As (A) and (B) but weighted by a normal distribution with mean 1.0 and standard deviation 0.1. D, E, and F: As (A-C), but for the city of Tromsø.

