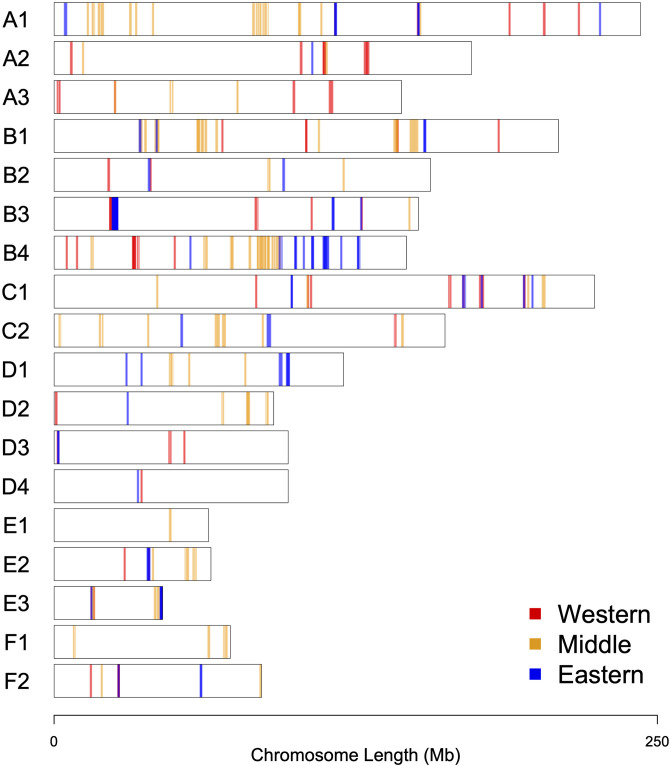
Fig 2. The genomic landscape of selection in domestic cat genome.
Chromosomal representation of 205 candidate regions under selection across all cat breeds. Colored vertical bars represent candidate regions under selection and the intensity of color reflects the number of breeds having the particular candidate region. Red, yellow, and blue colored bars correspond to Western (9), “Middle” (11), and Eastern (6) breeds, respectively.

