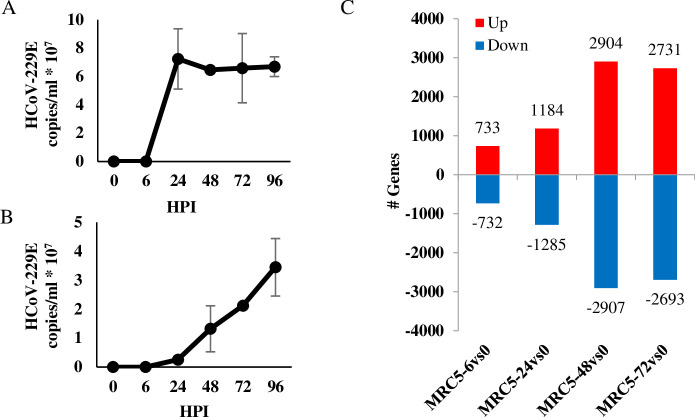
Fig 1. Change in gene expression following HCoV-229E infection.
(A-B) Viral propagation of HCoV-229E. MRC-5 cells, 24-hour culture to 80–90% confluency, were infected with 0.01 multiplicity of infection (MOI) of HCoV-229E virus. Cells and virus were grown in Eagle’s Minimum Essential Medium (EMEM) supplemented with 2% fetal calf serum (FCS) and incubated in a humidified incubator with 5% CO2, at 35°C. Total RNA was extracted at the indicated hours post infection (HPI) and viral load was determined in both cells (A) or growth media (B) by qPCR analysis. (C) Active transcripts in HCoV-229E –infected MRC-5 cells. Total RNA samples of MRC-5-infected cells (from section A) were prepared using the Illumina TruSeq RNA Library Preparation Kit v2 and sequenced in Illumina HiSeq 2500 Sequencer. Software and applications used for sequencing and data analysis are specified in the methods. Total number of upregulated (>2 fold change, red bars) or downregulated (<-2 fold change, blue bars) genes at the indicated HPI was calculated by comparing to gene expression to that measured in uninfected cells.

