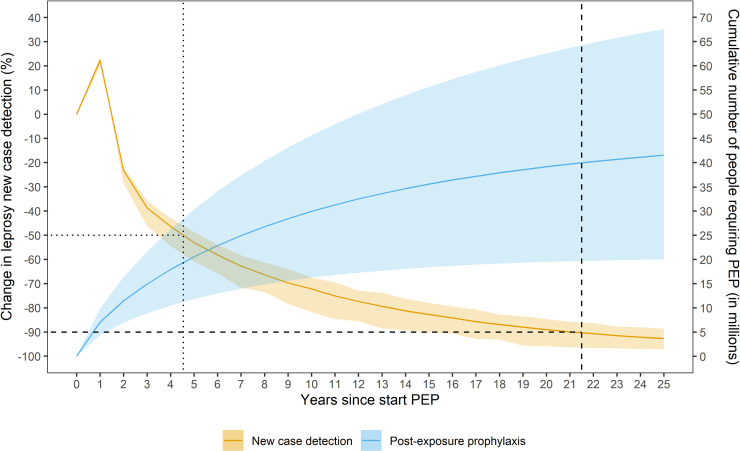
Fig 1. The global change in new case detection and cumulative number of people requiring post-exposure prophylaxis (PEP) over a period of 25 years.
The orange line represents the change in the new case detection (NCD) and its 95% confidence interval. The blue line is the cumulative number of people requiring post-exposure prophylaxis and its 95% confidence interval. The dotted and dashed vertical line represents the time of 50% and 90% reduction in NCD, respectively.

