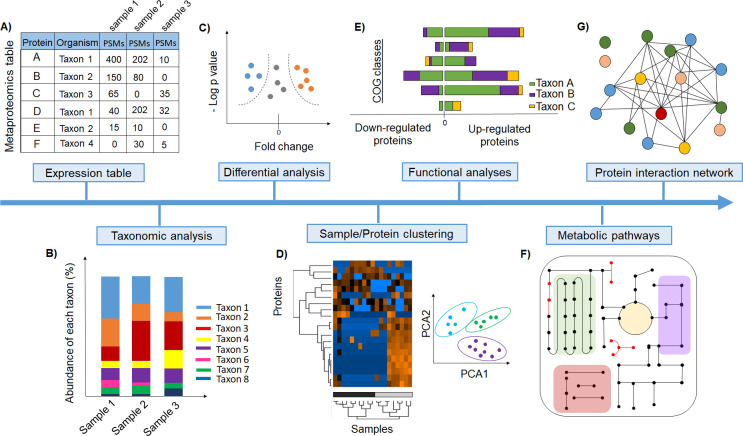
Fig 2. Examples of different analysis approaches to extract and help the interpretation of biological information from metaproteome datasets.
(A) Table containing all proteins identified per taxon and associated PSMs. (B) Microbiome composition in terms of biomass contributions can be provided by the summed relative protein abundance of each taxon. (C) Volcano plots display abundance differences and thresholds derived from statistical tests corrected for multiple hypothesis testing and allow for the identification of differentially abundant proteins between treatments/conditions. (D) Multivariate analyses, visualized by PCA plots and hierarchical clustering, help to classify samples according to protein abundance differences. (E) COG represent functional protein groups across different microbes. (F) Pathway reconstruction supported by pathway databases. (G) Analyses of protein–protein interaction networks by mapping protein functional categories. These types of tests and visualizations are available through R packages [30] or the free GUI-based software Perseus [31] customized for proteomic data analysis. COG, Clusters of Ortholog Groups; PCA, principal component analysis; PSM, peptide-spectrum match.

