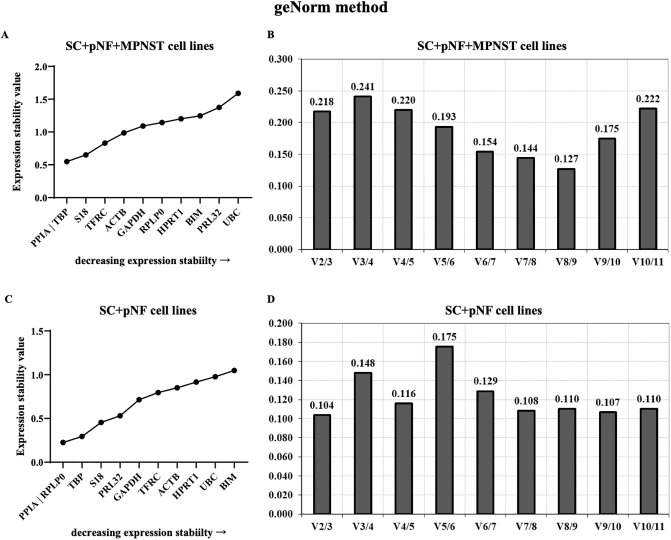
Fig 2. Analysis results of geNorm program.
The expression stability of eleven candidate genes in SC + pNF + MPNST subset (A) and SC + pNF subset (C) was calculated and ranked separately. The x-axis represents various candidate reference genes, and the y-axis represents stability value (M value). Lower M value suggests higher expression stability. B and D show the optimal number of reference genes in different subsets. The x-axis represents the number of genes selected for comprehensive analysis V (n/n+1), and the y-axis means the pairwise variation value (V value). When V value is under 0.15, the corresponding combination is esteemed stable and n is the best number of internal reference genes. SC, Schwann cell; pNF, plexiform neurofibroma; MPNST, malignant peripheral nerve sheath tumor.

