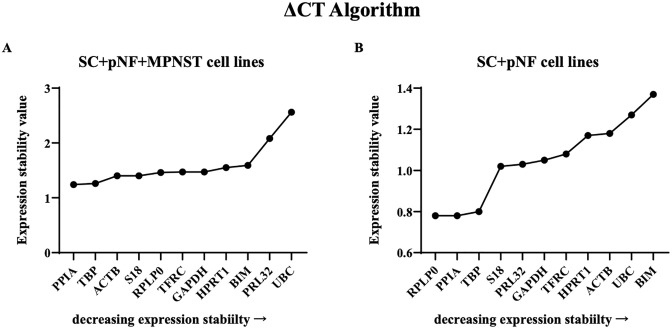
Fig 5. Analysis results of ΔCt algorithm.
The x-axis represents various candidate reference genes, and the y-axis represents stability value. (A) The stability value of each candidate internal reference gene in SC + pNF + MPNST subset (n = 14). (B) The stability value of each candidate internal reference gene in SC + pNF subset (n = 7). SC, Schwann cell; pNF, plexiform neurofibroma; MPNST, malignant peripheral nerve sheath tumor.

