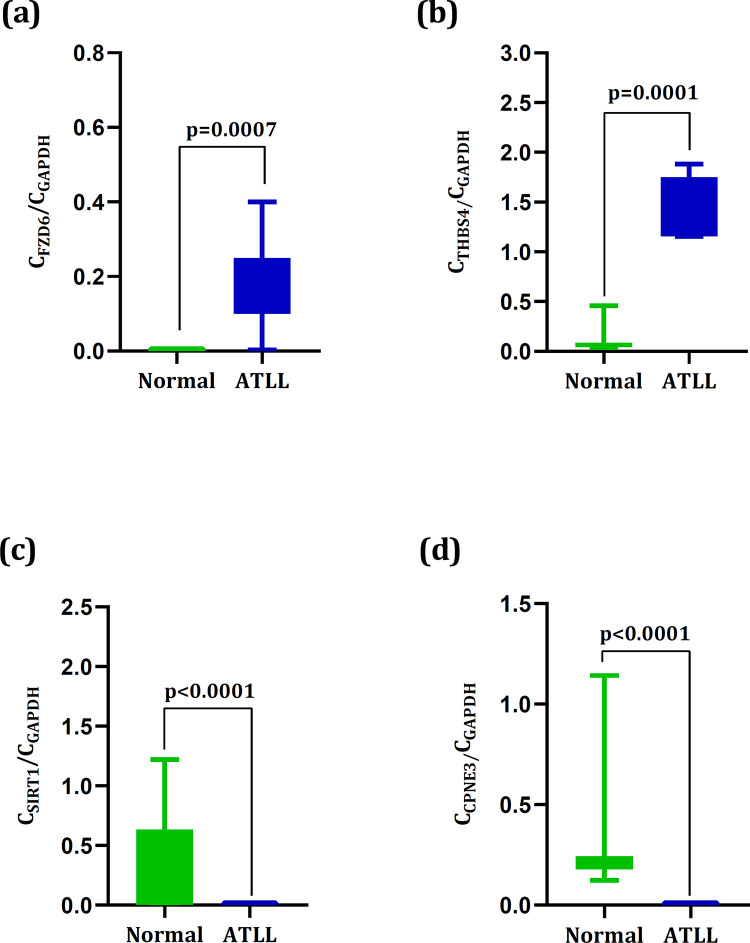
Fig 4.
The expression levels of (a) FZD6, (b) THBS4, (c) SIRT1, and (d) CPNE3 in the normal and ATLL groups. The expression levels of FZD6 and THBS4 in the ATLL samples were significantly higher than in normal (p< 0.0001 and p< 0.0001). The expression levels of SIRT1 and CPNE3 in the ATLL samples were significantly lower than in normal (p = 0.0007 and p = 0.0001).

