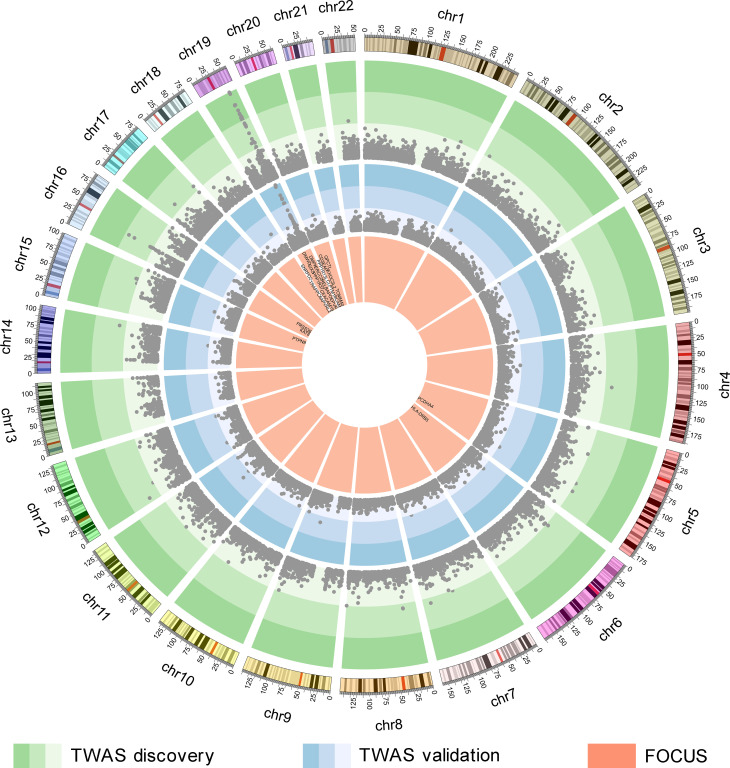
Fig 3. Genes identified by TWAS and FOCUS.
The green circle shows the genes identified by the AD-TWAS in hippocampal tissue, each point represents a single gene, with physical position in human genome plotted on the x-axis and -log10(p) of association between cis-GReX in hippocampal tissue and AD plotted on the y-axis. The color gradients represent significant levels and points located in the green and darker green regions indicate significant associations with AD at the 5% FDR threshold. The blue circle shows the AD-TWAS results of validation stage. The orange circle shows the results of FOCUS, the 24 genes showed in the figure are included in 90% credible gene sets. AD, Alzheimer’s disease; cis-GReX, cis-genetically regulated expression; FDR, false discovery rate; FOCUS, fine-mapping of causal gene sets; TWAS, transcriptome-wide association study.

