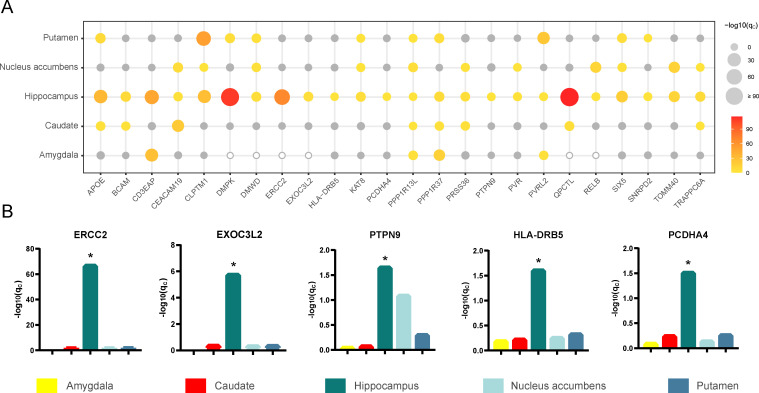
Fig 4. TWAS results of different subcortical tissues.
(A) The bubble plot shows TWAS results of different subcortical tissues. The x-axis shows the 24 prioritized AD-related genes, the y-axis shows the five types of brain tissues. The size and the color of the bubbles demonstrate the significance of each gene in TWAS of a given tissue. The gray bubbles represent non-significant associations in TWAS, the hollow bubbles reflect the genes whose prediction models are not established successfully. (B) The bar plots show the FDR corrected p-values in TWAS for the five genes associated with AD only in hippocampal tissue (qc < 0.05, FDR corrected). AD, Alzheimer’s disease; FDR, false discovery rate; TWAS, transcriptome-wide association study. *qc < 0.05.

