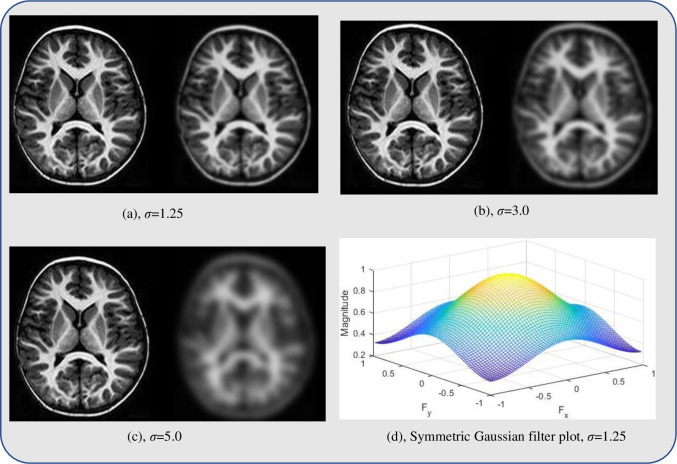
Fig 2. Visual comparison of a neuroimage sample at a different value of σ.
In (a), (b), and (c), the left side is a noisy image; the right side is a Gaussian smooth image. (a) GM area which constitutes the main ROI of the study is distinguishable from WM and background areas after smoothing; for (b) GM is fairly distinguishable after smoothing; (c) GM area becomes blur when σ>3; (d) shows the symmetrical property of the filter at σ = 1.25.

