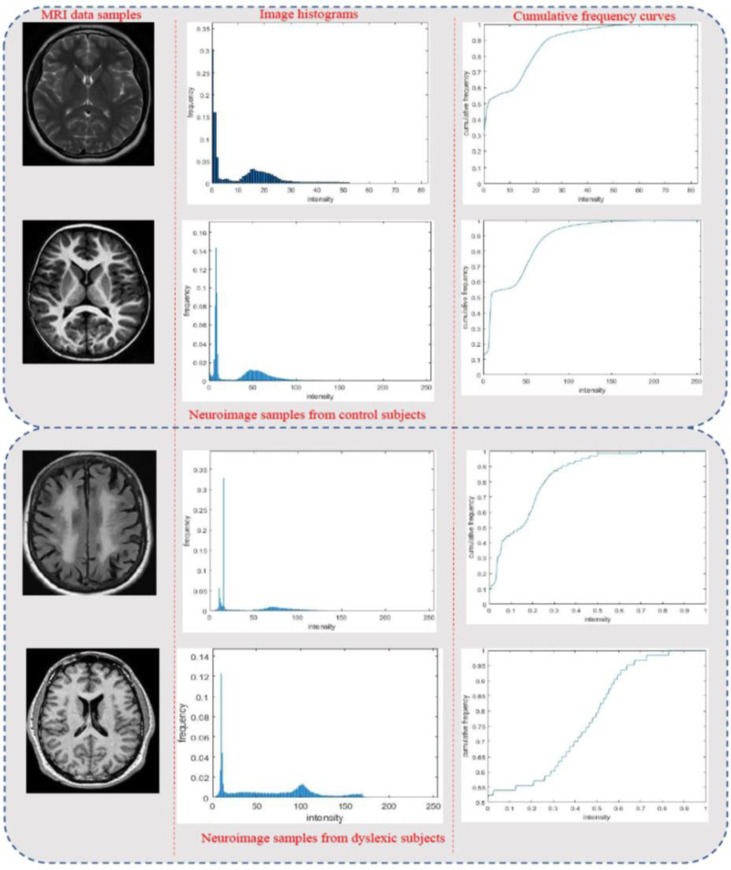
Fig 5. Visual inspection of image histograms and CFCs for four randomly selected neuroimages before MHN.
(a) the first column shows image samples from both controls and dyslexic group, (b) the second column shows their transformed histograms, while (c) the third column shows their CFCs. The first two rows are samples drawn from the control group, while the last two rows are samples drawn from the dyslexic group.

