
Fig 6. Sequence changes observed in SARS-CoV-2 CVR-GLA-1 following in vitro propagation.
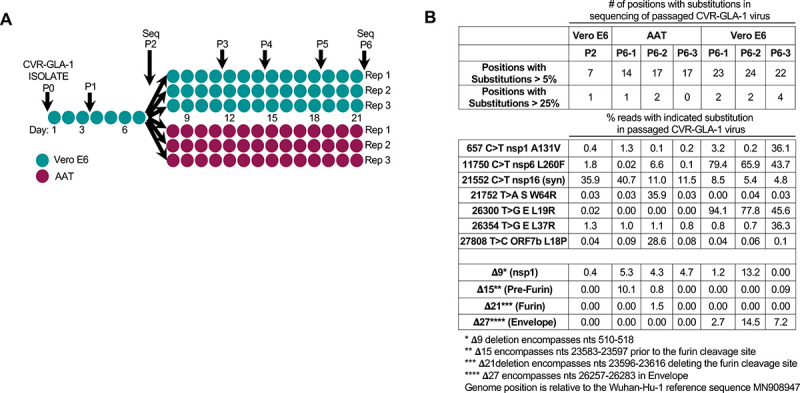
(A) A schematic of the passage history of the SARS-CoV-2 CVR-GLA-1 virus in Vero E6 and AAT cells. Each filled circle represents 1 day of propagation. (B) A summary of the variation generated during the passage of the CVR-GLA-1 virus indicated in panel A. The variation is detailed in S1 Table. The percentage of the viral swarm displaying all variants that exceed 5% or 25% of the swarm at any time point is shown. The percentage occurrence of several deletion mutants is highlighted for interest. AAT, A549-ACE2-TMPRSS2; SARS-CoV-2, Severe Acute Respiratory Syndrome Coronavirus 2.