
Fig 5.
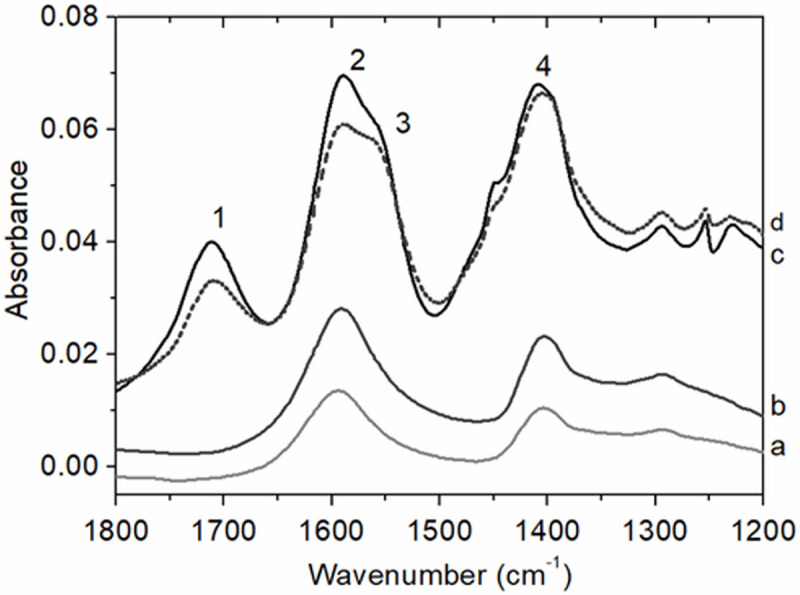
ATR-FTIR spectra of alginates (a: LV and b: HV3) and CLAMs (c: HV3 CLAMs and d: LV CLAMs) in the 1200–1800 cm-1 range. Both alginates and CLAMs spectra contain absorption peaks for asymmetric and symmetric COO- stretching vibration (centered at 1595 cm-1 (peak 2) and 1410 cm-1 (peak 4), respectively) indicating the presence of alginate salts. The appearance of an absorption peak for carboxylic acid at 1710 cm-1 (peak 1) in the CLAMs spectra is due to the presence of alginic acids. Additionally the peak centered at 1550 cm-1 (peak 3) in the CLAMs spectra indicate the formation of an amine salt.