
Fig. 2. Comparative of gene expression analysis the phf6/hTLX1, hulk, hMYC, otg, and shrek T-ALL models.
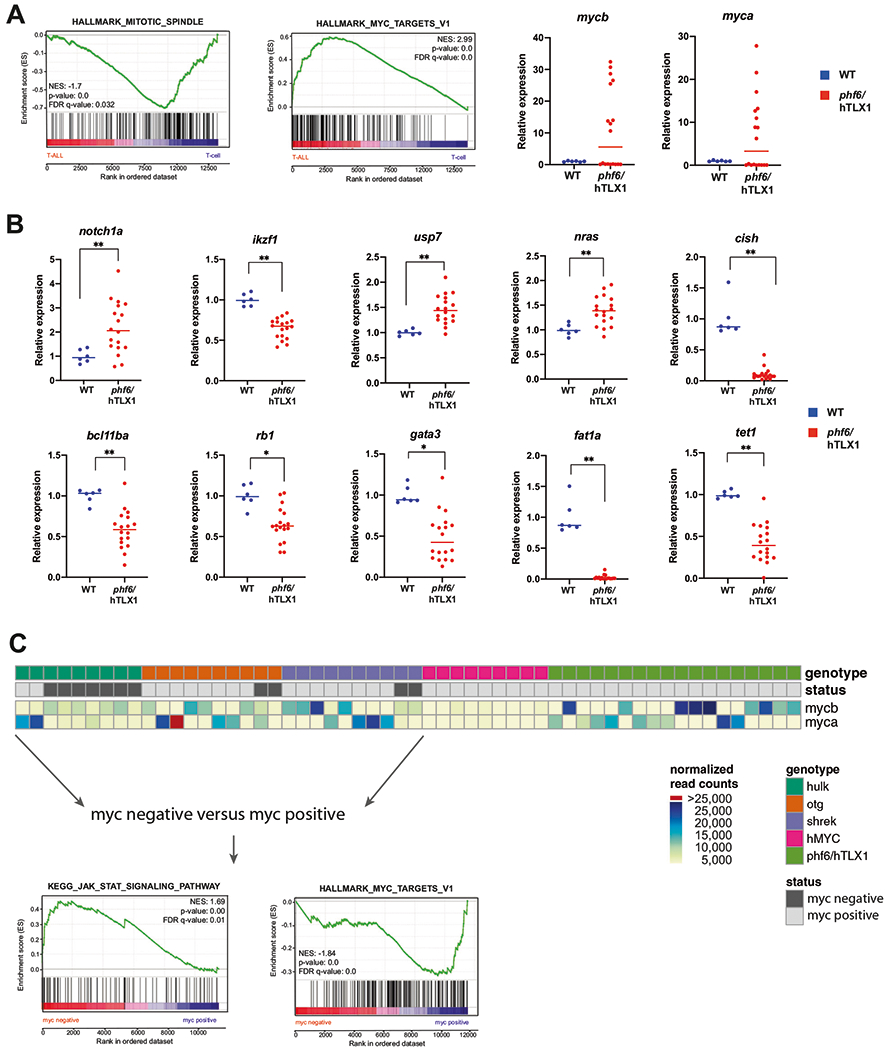
a (left) GSEA of differentially expressed genes in phf6/hTLX1 T-ALL compared to WT thymocytes. (right) Relative expression for myca and mycb in T-ALL samples (red) versus WT thymocytes (blue). The median of each group is indicated by a horizontal line. b Relative expression of notch1a, ikzf1, usp7, nras, cish, bcl11ba, rb1, gata3, fat1a, and tet1 in phf6/hTLX1 T-ALL samples (red) versus WT thymocytes (blue) (*p < 0.05; **p < 0.001). The median of each group is indicated by a horizontal line. c Schematic overview of all T-ALL samples with respect to their activation Myc, as determined by their overexpression of myca or mycb compared to wild-type thymocytes or the introduction of the hMYC transgene. Heatmap indicates normalized read counts of myca and mycb. GSEA analysis of myc negative samples compared to myc-positive samples of the hulk, otg, shrek T-ALLs reveals a positive enrichment for JAK/STAT targets, while a negative enrichment for MYC targets is detected.