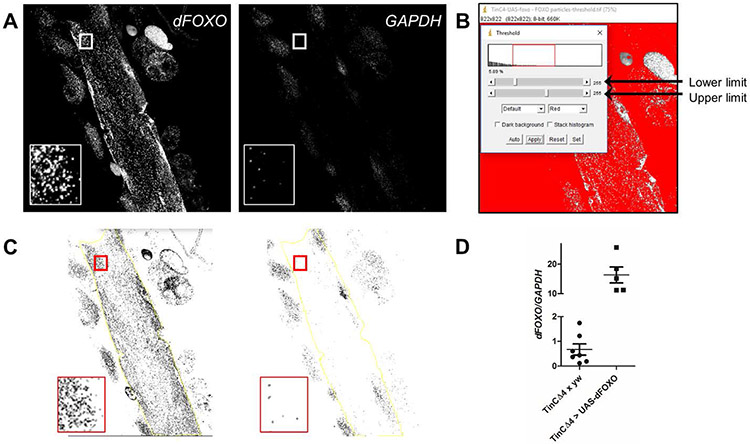
Fig. 3. Quantitation of dFOXO mRNA particles from a ViewRNA FISH experiment in a semi-intact Drosophila heart tube preparation.
(A) Representative images of a tinCΔ4-GAL4 > UAS-dFOXO heart, probed for dFOXO and GAPDH transcripts, converted to grayscale for analysis using ImageJ. Inset displays a region of interest (cardiomyocyte) prior to threshold modification. (B) After conversion to 8-bit, the threshold of each image is arbitrarily changed to a range between 55 and 150 to help eliminate background signals and off-target probe binding from subsequent particle analysis. (C) Representative images, post-threshold adjustment, with the inset displaying the same cardiomyocyte data as in (A). Larger regions of interest, which exclude non-cardiac tissue, can be selected using the free-hand tool in ImageJ (yellow line). (D) Values from tinCΔ4-GAL4 × yw control vs. tinCΔ4-GAL4 > UAS-dFOXO hearts (Fig. 2C and C’) were obtained using the ImageJ particle analysis tool. dFOXO/GAPDH was calculated for each heart or region of interest. The graph shows a small representation of the difference calculated in normalized dFOXO transcripts between the hearts of the two genotypes. The use of ViewRNA to detect more subtle changes in cardiac dFOXO transcript levels was previously published [23].

