
Fig. 5.
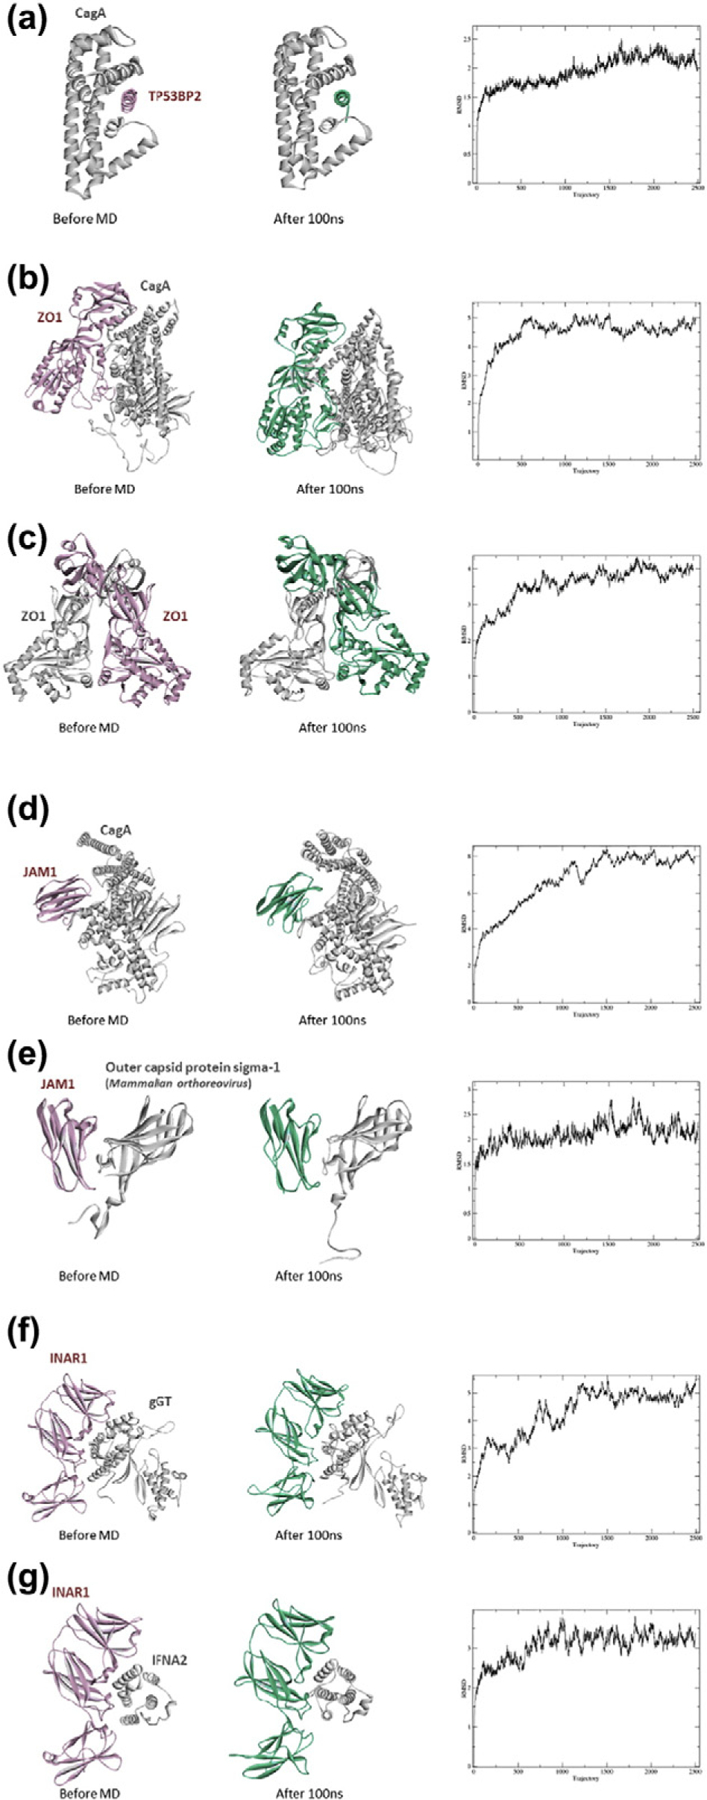
MD results for four HPI models and their corresponding template PPIs. The first figure in each panel shows the initial conformation of the HPI/PPI, and the second figure shows the conformation after 100-ns simulation. The last figure shows the RMSD values with respect to the initial structures.